

【RCI3本ラインとmBDSRの活用例】押し安値割れからの戻り売りを狙う!!(3)
0
An Indicator that Captures Tops and Bottoms with RCI Combination: mBDSR
Methods and Case Studies (PDF) ★GogoJungle AWARD2020 Winner★
https://www.gogojungle.co.jp/tools/indicators/11836
The above product includes 301 PDFs (methods, case studies, etc.). For a list of the PDF titles, please see the article below.
About the 301 PDF files included with 【BODSOR・mBDSR】
https://www.gogojungle.co.jp/finance/navi/articles/34271
CHF/JPY, 1-hour chart
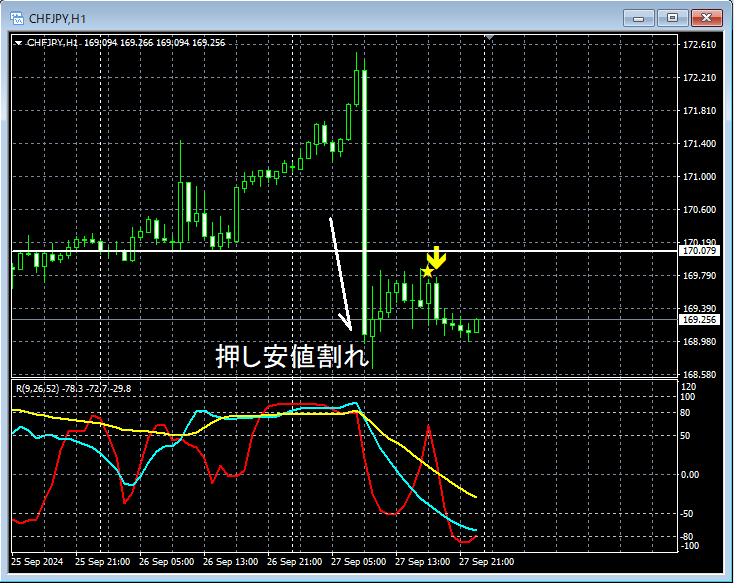
We will omit the status of the higher timeframes. Also,the explanation of the downscaling from higher to lower timeframes using RCIis detailed in the accompanying PDF, so it will be omitted here as well. We are not simply looking at the 1-hour chart haphazardly.
In actual trading, when planning a strategy,understanding the higher-timeframe situationanddownscaling from higher to lower timeframes using RCIare extremely important.
In the upper 1-hour chart,a breakout below a support swing lowleads to a rise,the mBDSR (RCI two-line filter)reversal signal lights up, and subsequently the price declines steadily.
From this example,the close relationship between RCI three-line strategies and Dow Theory trading approachesandthe signals of mBDSRbecome evident.
Indicator that shines when combined with RCI: 【BODSOR・mBDSR】
Methods and Case Studies (PDF) ★GogoJungle AWARD2020 Winner★
https://www.gogojungle.co.jp/tools/indicators/11836
301 PDF files are included.
Many of them are summaries of how to logically link higher and lower timeframes using three RCI lines, sequentially examining the scenarios of multiple lower timeframes, and ultimately waiting for timing on the lower timeframe buys on dips or sells on rallies (i.e., the mBDSR signals).Also,
many of them focus on identifying points where multiple entry reasons overlap.There are many such cases.
In the explanations,over 1,000 chartsare used.

Methods and Case Studies (PDF) ★GogoJungle AWARD2020 Winner★
https://www.gogojungle.co.jp/tools/indicators/11836
The above product includes 301 PDFs (methods, case studies, etc.). For a list of the PDF titles, please see the article below.
About the 301 PDF files included with 【BODSOR・mBDSR】
https://www.gogojungle.co.jp/finance/navi/articles/34271
CHF/JPY, 1-hour chart
We will omit the status of the higher timeframes. Also,the explanation of the downscaling from higher to lower timeframes using RCIis detailed in the accompanying PDF, so it will be omitted here as well. We are not simply looking at the 1-hour chart haphazardly.
In actual trading, when planning a strategy,understanding the higher-timeframe situationanddownscaling from higher to lower timeframes using RCIare extremely important.
In the upper 1-hour chart,a breakout below a support swing lowleads to a rise,the mBDSR (RCI two-line filter)reversal signal lights up, and subsequently the price declines steadily.
From this example,the close relationship between RCI three-line strategies and Dow Theory trading approachesandthe signals of mBDSRbecome evident.
Indicator that shines when combined with RCI: 【BODSOR・mBDSR】
Methods and Case Studies (PDF) ★GogoJungle AWARD2020 Winner★
https://www.gogojungle.co.jp/tools/indicators/11836
301 PDF files are included.
Many of them are summaries of how to logically link higher and lower timeframes using three RCI lines, sequentially examining the scenarios of multiple lower timeframes, and ultimately waiting for timing on the lower timeframe buys on dips or sells on rallies (i.e., the mBDSR signals).Also,
many of them focus on identifying points where multiple entry reasons overlap.There are many such cases.
In the explanations,over 1,000 chartsare used.
× ![]()


