

[RCI3 Three-Line and mBDSR usage example] Targeting a pullback sell after breaking the support level!! (2)
0
Indicator that captures “tops and bottoms and reversals” in combination with RCI【mBDSR】
Methods and Case Studies (PDF) ★GogoJungle AWARD2020 Winner★
https://www.gogojungle.co.jp/tools/indicators/11836
The above product includes 301 PDFs (methods, case studies, etc.). For a list of titles of those PDFs, please see the article below.
About the 301 PDF files included with 【BODSOR・mBDSR】
https://www.gogojungle.co.jp/finance/navi/articles/34271
EURJPY - 30-minute chart
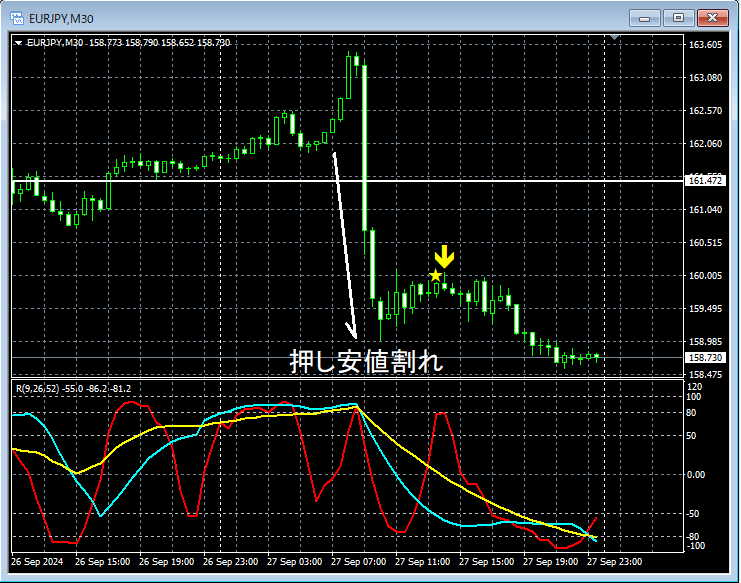
The status of higher timeframes is omitted. Also,drilling down from higher timeframes to lower timeframes using RCIis explained in detail in the attached PDF, so it is omitted here as well. It is not just a casual look at the 30-minute chart.
In actual trading, when developing a plan,awareness of the higher-timeframe conditionsanddrilling down from higher timeframes to lower timeframes using RCIare extremely important.
On the above 30-minute chart,a breakout below the swing lowis followed by a rise wheremBDSR (RCI two-line filter)reversal signal lights up, and price subsequently declines smoothly.
From this example,the compatibility between trading methods focusing on the three RCI lines and Dow Theoryandthe signals of mBDSRis evident.
Indicator that excels when combined with RCI【BODSOR・mBDSR】
Methods and Case Studies (PDF) ★GogoJungle AWARD2020 Winner★
https://www.gogojungle.co.jp/tools/indicators/11836
301 PDF files are included.
Many of them are examples that break down how, by linking higher and lower timeframes logically using three RCI lines, multiple lower-timeframe conditions are considered sequentially, and finally wait for a pullback buying or a retracement selling timing (i.e., mBDSR signals) on the lower timeframe.They also put emphasis on identifying points where multiple entry reasons overlap.
In the explanations,over 1,000 chart imagesare used.

Methods and Case Studies (PDF) ★GogoJungle AWARD2020 Winner★
https://www.gogojungle.co.jp/tools/indicators/11836
The above product includes 301 PDFs (methods, case studies, etc.). For a list of titles of those PDFs, please see the article below.
About the 301 PDF files included with 【BODSOR・mBDSR】
https://www.gogojungle.co.jp/finance/navi/articles/34271
EURJPY - 30-minute chart
The status of higher timeframes is omitted. Also,drilling down from higher timeframes to lower timeframes using RCIis explained in detail in the attached PDF, so it is omitted here as well. It is not just a casual look at the 30-minute chart.
In actual trading, when developing a plan,awareness of the higher-timeframe conditionsanddrilling down from higher timeframes to lower timeframes using RCIare extremely important.
On the above 30-minute chart,a breakout below the swing lowis followed by a rise wheremBDSR (RCI two-line filter)reversal signal lights up, and price subsequently declines smoothly.
From this example,the compatibility between trading methods focusing on the three RCI lines and Dow Theoryandthe signals of mBDSRis evident.
Indicator that excels when combined with RCI【BODSOR・mBDSR】
Methods and Case Studies (PDF) ★GogoJungle AWARD2020 Winner★
https://www.gogojungle.co.jp/tools/indicators/11836
301 PDF files are included.
Many of them are examples that break down how, by linking higher and lower timeframes logically using three RCI lines, multiple lower-timeframe conditions are considered sequentially, and finally wait for a pullback buying or a retracement selling timing (i.e., mBDSR signals) on the lower timeframe.They also put emphasis on identifying points where multiple entry reasons overlap.
In the explanations,over 1,000 chart imagesare used.
× ![]()


