

[RCI3 single-line and mBDSR usage example] Targeting a pullback sell after breaking the short-term low!! (1)
0
Indicator that captures the bottom/top reversal when combined with RCI: 【mBDSR】
Methods & Case Studies (PDF) ★GogoJungle AWARD 2020 Winner★
https://www.gogojungle.co.jp/tools/indicators/11836
The above products include 301 PDFs (methods, case studies, etc.). For a list of the titles of those PDFs, please see the article below.
About the 301 PDF files included with 【BODSOR・mBDSR】
https://www.gogojungle.co.jp/finance/navi/articles/34271
EURCHF — Euro/Swiss Franc — 30-minute chart
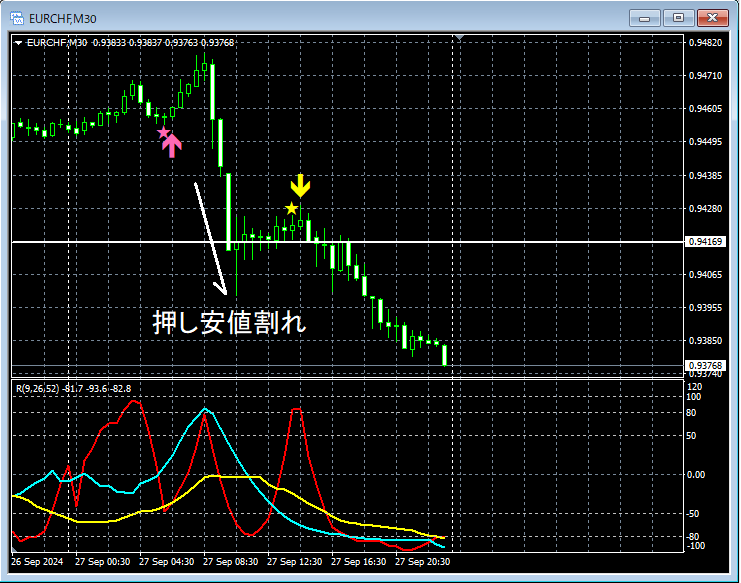
The status on higher timeframes is omitted. On the 30-minute chart above,the rally after breaking below a support lowis followed bya buyback signal from mBDSR (2 RCI lines filter)and prices subsequently decline steadily.
From this example,the high harmony between trading methods focused on Dow Theoryandthe signals of mBDSRis evident.
Indicator that shines in combination with RCI: 【BODSOR・mBDSR】
Methods & Case Studies (PDF) ★GogoJungle AWARD2020 Winner★
https://www.gogojungle.co.jp/tools/indicators/11836
The PDF files are 301 in total.
Many of them summarize examples that logically link higher and lower timeframes using 3 RCI lines, examining the status of multiple lower-timeframe charts step by step, and ultimately waiting for entry timing on the lower timeframe (i.e., mBDSR signals) such as buy-the-dull or sell-the-rally .
Also,many focus on capturing points where multiple entry reasons overlap.
The description usesover 1,000 charts.

Methods & Case Studies (PDF) ★GogoJungle AWARD 2020 Winner★
https://www.gogojungle.co.jp/tools/indicators/11836
The above products include 301 PDFs (methods, case studies, etc.). For a list of the titles of those PDFs, please see the article below.
About the 301 PDF files included with 【BODSOR・mBDSR】
https://www.gogojungle.co.jp/finance/navi/articles/34271
EURCHF — Euro/Swiss Franc — 30-minute chart
The status on higher timeframes is omitted. On the 30-minute chart above,the rally after breaking below a support lowis followed bya buyback signal from mBDSR (2 RCI lines filter)and prices subsequently decline steadily.
From this example,the high harmony between trading methods focused on Dow Theoryandthe signals of mBDSRis evident.
Indicator that shines in combination with RCI: 【BODSOR・mBDSR】
Methods & Case Studies (PDF) ★GogoJungle AWARD2020 Winner★
https://www.gogojungle.co.jp/tools/indicators/11836
The PDF files are 301 in total.
Many of them summarize examples that logically link higher and lower timeframes using 3 RCI lines, examining the status of multiple lower-timeframe charts step by step, and ultimately waiting for entry timing on the lower timeframe (i.e., mBDSR signals) such as buy-the-dull or sell-the-rally .
Also,many focus on capturing points where multiple entry reasons overlap.
The description usesover 1,000 charts.
× ![]()


