

[RCI3 Three-Line and mBDSR Usage Example] Look for signs of rebound near the moving average lines that are considered important
0
An Indicator That Captures Tops/Bottoms with RCI Combination: 【mBDSR】
Methods & Case Studies (PDF) ★GogoJungle AWARD2020 Winner★
https://www.gogojungle.co.jp/tools/indicators/11836
The above products include 301 PDFs (methods, case studies, etc.). For a list of the PDF titles, please refer to the article below.
About the 301 PDF files included with 【BODSOR・mBDSR】
https://www.gogojungle.co.jp/finance/navi/articles/34271
NZD/CAD 15-minute chart
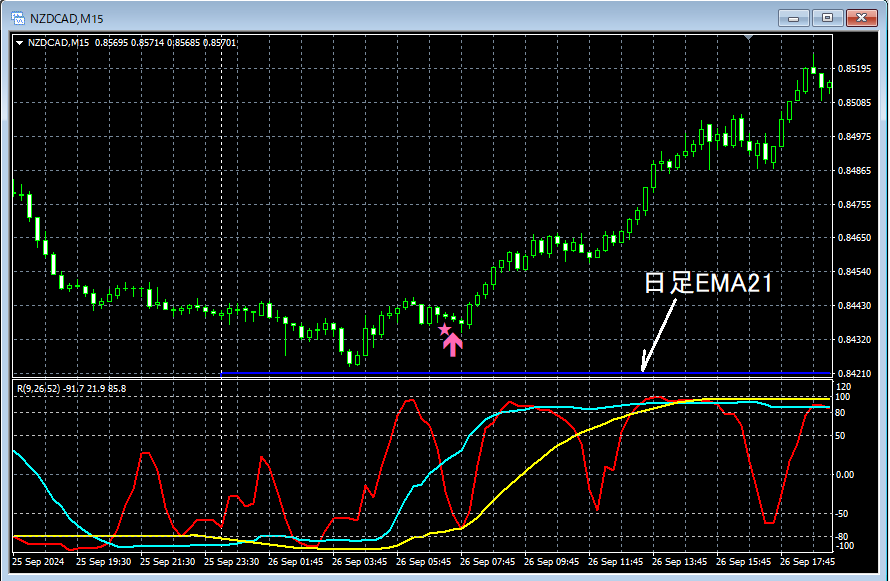
The status of the higher timeframes is omitted. Also,Using RCI to map from higher timeframes to lower timeframesis described in detail in the accompanying PDF, so it is also omitted here. It is not simply looking at a 15-minute chart casually.
In actual trading, when formulating a plan,understanding the higher timeframe contextandmapping from higher to lower timeframes using RCI
Looking at the above 15-minute chart, what is emphasized herethe daily EMA21is showing a rebound tendency. After that,the mBDSR (RCI two-filter) pullback buy signallights up and the price rises significantly.
From this example,a trading method focused on rebounds at moving averages and the RCI three-line patternandthe signals of mBDSRshow a high degree of compatibility.
Also, in this example, placing a stop slightly below the most recent lowand achieving a favorable risk-reward tradeis possible.
The indicator that shines when combined with RCI: 【BODSOR・mBDSR】
Methods & Case Studies (PDF) ★GogoJungle AWARD2020 Winner★
https://www.gogojungle.co.jp/tools/indicators/11836
The PDF files total 301 files (over 1,000 pages, over 350,000 characters).
Many of them explain a process of logically linking higher and lower timeframes using the RCI three-line pattern, sequentially considering multiple lower timeframes, and ultimately waiting for a pullback buy or pullback sell timing in the lower timeframes (i.e., the mBDSR signals).Additionally,
many of them emphasize identifying points where multiple entry justifications overlap.There are many such cases.
The explanations useover 1,000 charts.

Methods & Case Studies (PDF) ★GogoJungle AWARD2020 Winner★
https://www.gogojungle.co.jp/tools/indicators/11836
The above products include 301 PDFs (methods, case studies, etc.). For a list of the PDF titles, please refer to the article below.
About the 301 PDF files included with 【BODSOR・mBDSR】
https://www.gogojungle.co.jp/finance/navi/articles/34271
NZD/CAD 15-minute chart
The status of the higher timeframes is omitted. Also,Using RCI to map from higher timeframes to lower timeframesis described in detail in the accompanying PDF, so it is also omitted here. It is not simply looking at a 15-minute chart casually.
In actual trading, when formulating a plan,understanding the higher timeframe contextandmapping from higher to lower timeframes using RCI
Looking at the above 15-minute chart, what is emphasized herethe daily EMA21is showing a rebound tendency. After that,the mBDSR (RCI two-filter) pullback buy signallights up and the price rises significantly.
From this example,a trading method focused on rebounds at moving averages and the RCI three-line patternandthe signals of mBDSRshow a high degree of compatibility.
Also, in this example, placing a stop slightly below the most recent lowand achieving a favorable risk-reward tradeis possible.
The indicator that shines when combined with RCI: 【BODSOR・mBDSR】
Methods & Case Studies (PDF) ★GogoJungle AWARD2020 Winner★
https://www.gogojungle.co.jp/tools/indicators/11836
The PDF files total 301 files (over 1,000 pages, over 350,000 characters).
Many of them explain a process of logically linking higher and lower timeframes using the RCI three-line pattern, sequentially considering multiple lower timeframes, and ultimately waiting for a pullback buy or pullback sell timing in the lower timeframes (i.e., the mBDSR signals).Additionally,
many of them emphasize identifying points where multiple entry justifications overlap.There are many such cases.
The explanations useover 1,000 charts.
× ![]()


