

RCI3 single line and mBDSR (RCI2 single filter) sign and resistance-support reversal
0
Indicator to "capture the bottom and reversal" in combination with RCI【mBDSR】
Methods and Case Studies (PDF) ★GogoJungle AWARD2020 Winner★
https://www.gogojungle.co.jp/tools/indicators/11836
The above product includes 301 PDFs. For a list of those PDFs’ titles and other details, please see the article below.
About the 301 PDF files included with 【BODSOR・mBDSR】
https://www.gogojungle.co.jp/finance/navi/articles/34271
GBP/CAD 1-hour chart
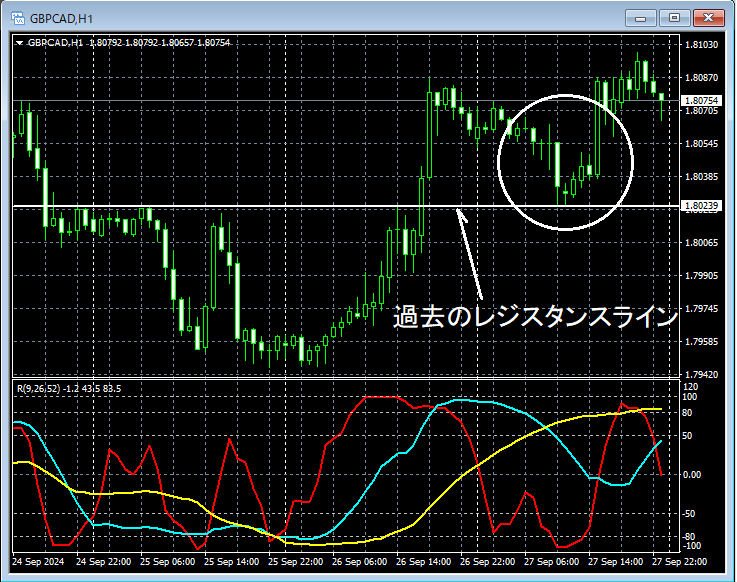
Looking at the area encircled by the white circle on the 1-hour chart above,it has fallen toward the previous resistance linenearby. Considering a possible rebound, we will carefully look for signs of a rebound on lower time frames.
GBP/CAD 15-minute chart
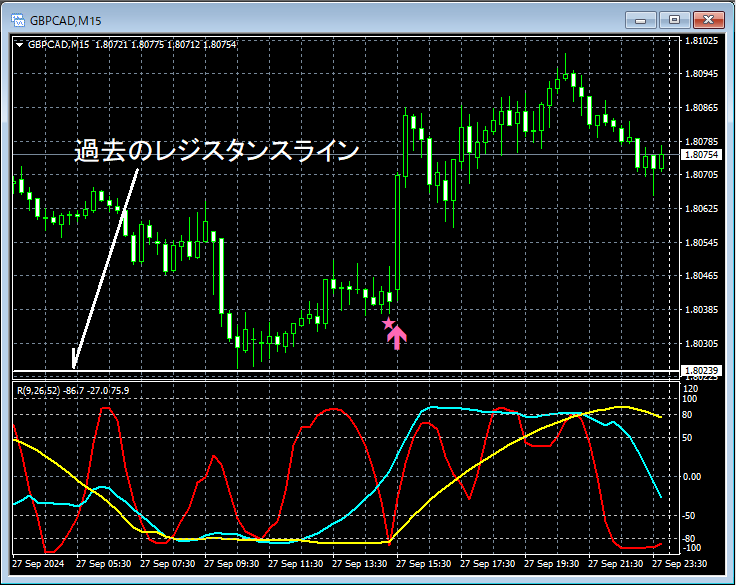
On the 15-minute chart above,there is a rebound from the previous resistance lineand subsequently,the mBDSR (RCI two-filter) pullback buy signallights up and the price clearly rises.
GBP/CAD 5-minute chart
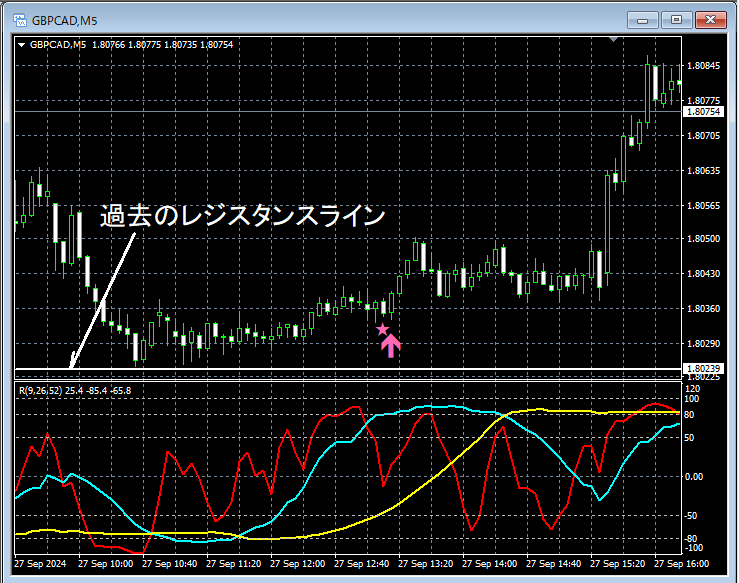
On the 5-minute chart above, at a timing earlier (more favorable) than the 15-minute chart,the mBDSR (RCI two-filter) pullback buy signallights up.
The method for drilling down from higher to lower timeframes is explained in detail in the PDF, so it is not repeated here. We are not just casually looking at 15-minute or 5-minute charts.
From this example,the high compatibility between the trade method focusing on support/resistance turnsandthe signals of mBDSRis evident.
Additionally, in this example, by placing the stop-loss slightly below the most recent low, a trade with favorable risk-reward is possible.
Indicator that powers in combination with RCI【BODSOR・mBDSR】
Methods and Case Studies (PDF) ★GogoJungle AWARD2020 Winner★
https://www.gogojungle.co.jp/tools/indicators/11836
The PDFs include 301 files (over 1,000 pages, over 350,000 words in total).
Most of them are about using three RCI lines to logically link higher and lower timeframes, sequentially considering multiple lower-timeframe conditions, and ultimately waiting for pullback buys in lower timeframes or sell-rebounds (i.e., mBDSR signals).They also include many examples that emphasize identifying points where multiple entry reasons overlap.
For explanations,more than 1,000 chartsare used.

Methods and Case Studies (PDF) ★GogoJungle AWARD2020 Winner★
https://www.gogojungle.co.jp/tools/indicators/11836
The above product includes 301 PDFs. For a list of those PDFs’ titles and other details, please see the article below.
About the 301 PDF files included with 【BODSOR・mBDSR】
https://www.gogojungle.co.jp/finance/navi/articles/34271
GBP/CAD 1-hour chart
Looking at the area encircled by the white circle on the 1-hour chart above,it has fallen toward the previous resistance linenearby. Considering a possible rebound, we will carefully look for signs of a rebound on lower time frames.
GBP/CAD 15-minute chart
On the 15-minute chart above,there is a rebound from the previous resistance lineand subsequently,the mBDSR (RCI two-filter) pullback buy signallights up and the price clearly rises.
GBP/CAD 5-minute chart
On the 5-minute chart above, at a timing earlier (more favorable) than the 15-minute chart,the mBDSR (RCI two-filter) pullback buy signallights up.
The method for drilling down from higher to lower timeframes is explained in detail in the PDF, so it is not repeated here. We are not just casually looking at 15-minute or 5-minute charts.
From this example,the high compatibility between the trade method focusing on support/resistance turnsandthe signals of mBDSRis evident.
Additionally, in this example, by placing the stop-loss slightly below the most recent low, a trade with favorable risk-reward is possible.
Indicator that powers in combination with RCI【BODSOR・mBDSR】
Methods and Case Studies (PDF) ★GogoJungle AWARD2020 Winner★
https://www.gogojungle.co.jp/tools/indicators/11836
The PDFs include 301 files (over 1,000 pages, over 350,000 words in total).
Most of them are about using three RCI lines to logically link higher and lower timeframes, sequentially considering multiple lower-timeframe conditions, and ultimately waiting for pullback buys in lower timeframes or sell-rebounds (i.e., mBDSR signals).They also include many examples that emphasize identifying points where multiple entry reasons overlap.
For explanations,more than 1,000 chartsare used.
× ![]()


