

Presidential Election【AUDJPY攻略20240927】Moving Averages, Pullback Lows, and mBDSR (RCI two-filter) Signals
0
Indicator that captures “tops and bottoms and reversals” in combination with RCI [mBDSR]
Methods and Case Studies (PDF) ★GogoJungle AWARD 2020 Recipient★
https://www.gogojungle.co.jp/tools/indicators/11836
The above products include 301 PDFs (methods, case studies, etc.). For a list of the titles of those PDFs, please refer to the article below.
Regarding the 301 PDF files included with 【BODSOR・mBDSR】
https://www.gogojungle.co.jp/finance/navi/articles/34271
AUDUSD JPY? Wait—AUDJPY, 1-hour chart
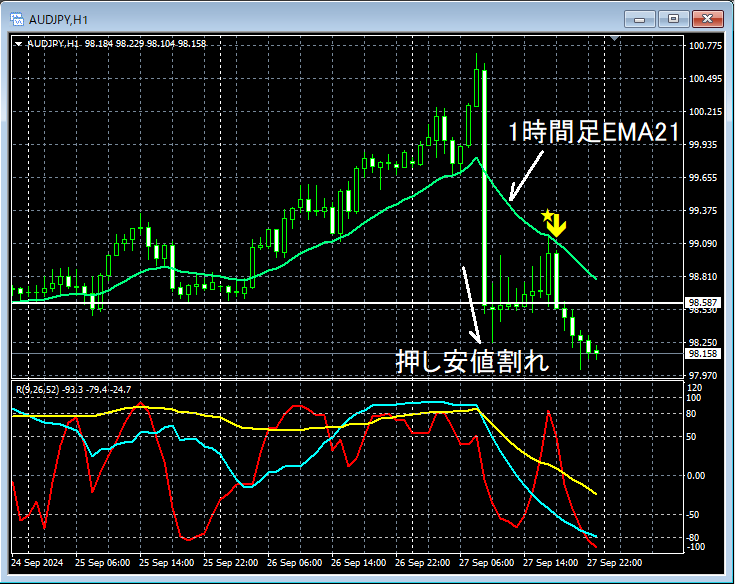
On the 1-hour chart above, the level that had been acting as support1-hour EMA21was breached, then further declinedpullback lowbroke. In the subsequent rally,mBDSR (2 filters with RCI lines)reversal signal appeared, and price has since been steadily moving down.
From this example,a trading approach focused on moving averages and Dow Theoryandthe signals of mBDSRappear to be highly compatible.
Indicator that shines in combination with RCI【BODSOR・mBDSR】
Methods and Case Studies (PDF) ★GogoJungle AWARD 2020 Recipient★
https://www.gogojungle.co.jp/tools/indicators/11836
PDF files are included: 301 in total.
Many of them explain the approach of logically linking higher and lower timeframes using three RCI lines, and ultimately detailing the scenario of waiting for buying on dips or selling on rallies on the lower timeframe (i.e., the mBDSR signals).In other words, they are compiled to illustrate an approach that progressively analyzes the situation across multiple lower timeframes via the RCI triple-line linkage.
Also,many focus on identifying points where multiple entry justifications coincide.
The descriptions usemore than 1,000 charts in total.

Methods and Case Studies (PDF) ★GogoJungle AWARD 2020 Recipient★
https://www.gogojungle.co.jp/tools/indicators/11836
The above products include 301 PDFs (methods, case studies, etc.). For a list of the titles of those PDFs, please refer to the article below.
Regarding the 301 PDF files included with 【BODSOR・mBDSR】
https://www.gogojungle.co.jp/finance/navi/articles/34271
AUDUSD JPY? Wait—AUDJPY, 1-hour chart
On the 1-hour chart above, the level that had been acting as support1-hour EMA21was breached, then further declinedpullback lowbroke. In the subsequent rally,mBDSR (2 filters with RCI lines)reversal signal appeared, and price has since been steadily moving down.
From this example,a trading approach focused on moving averages and Dow Theoryandthe signals of mBDSRappear to be highly compatible.
Indicator that shines in combination with RCI【BODSOR・mBDSR】
Methods and Case Studies (PDF) ★GogoJungle AWARD 2020 Recipient★
https://www.gogojungle.co.jp/tools/indicators/11836
PDF files are included: 301 in total.
Many of them explain the approach of logically linking higher and lower timeframes using three RCI lines, and ultimately detailing the scenario of waiting for buying on dips or selling on rallies on the lower timeframe (i.e., the mBDSR signals).In other words, they are compiled to illustrate an approach that progressively analyzes the situation across multiple lower timeframes via the RCI triple-line linkage.
Also,many focus on identifying points where multiple entry justifications coincide.
The descriptions usemore than 1,000 charts in total.
× ![]()


