

Movement of USD/JPY around the presidential election and Bollinger Bands and the mBDSR (RCI two-filter) retracement sell signal
0
Indicator 【mBDSR】 that captures bottoms, tops, and reversals in combination with RCI
Method and Case Study (PDF) ★GogoJungle AWARD2020 Winner★
https://www.gogojungle.co.jp/tools/indicators/11836
The above product includes 301 PDFs. For a list of the PDF titles, please refer to the article below.
About the 301 PDF files included with 【BODSOR・mBDSR】
https://www.gogojungle.co.jp/finance/navi/articles/34271
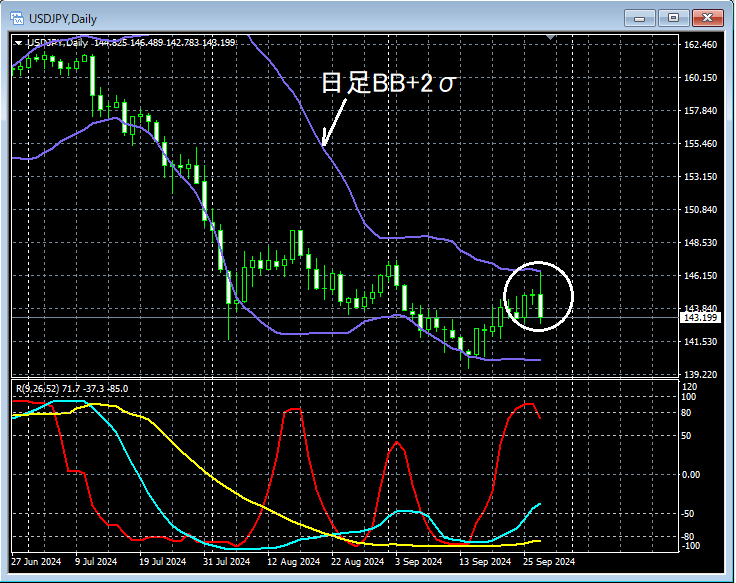
USDJPY Daily
USDJPY 1-Minute
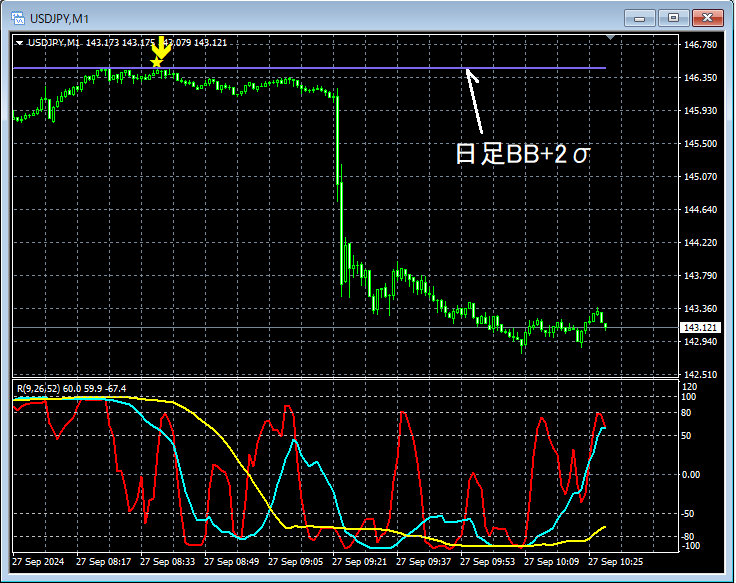
In preparation for the presidential election, firstlyDaily BB (Bollinger Bands) +2σ rises. Then on the 1-minute chart,the return-sell signal of mBDSR (two RCI filters) lights up. After that, the price plummets following the election result.
From this example,a trading method focusing on contrarian moves in Bollinger Bands andthe signal of mBDSR show a strong harmony.
Additionally, in this example, by placing the stop-loss slightly above the recent high,a high risk-reward favorable trade is possible.
Indicator 【BODSOR・mBDSR】 that shines in combination with RCI
Method and Case Study (PDF) ★GogoJungle AWARD2020 Winner★
https://www.gogojungle.co.jp/tools/indicators/11836
The PDF files number 301 (over 1,000 pages, over 350,000 characters in total).
Most of them are summaries of cases where, by using three RCI lines to logically link higher and lower timeframes, various lower-timeframe conditions are sequentially examined, ultimately waiting for a timing to buy on dips or sell on rallies on the lower timeframe (i.e., the mBDSR signal)..
Furthermore,many focus on identifying points where multiple entry reasons overlap..
In the explanations,more than 1,000 charts are used.

Method and Case Study (PDF) ★GogoJungle AWARD2020 Winner★
https://www.gogojungle.co.jp/tools/indicators/11836
The above product includes 301 PDFs. For a list of the PDF titles, please refer to the article below.
About the 301 PDF files included with 【BODSOR・mBDSR】
https://www.gogojungle.co.jp/finance/navi/articles/34271
USDJPY Daily
USDJPY 1-Minute
In preparation for the presidential election, firstlyDaily BB (Bollinger Bands) +2σ rises. Then on the 1-minute chart,the return-sell signal of mBDSR (two RCI filters) lights up. After that, the price plummets following the election result.
From this example,a trading method focusing on contrarian moves in Bollinger Bands andthe signal of mBDSR show a strong harmony.
Additionally, in this example, by placing the stop-loss slightly above the recent high,a high risk-reward favorable trade is possible.
Indicator 【BODSOR・mBDSR】 that shines in combination with RCI
Method and Case Study (PDF) ★GogoJungle AWARD2020 Winner★
https://www.gogojungle.co.jp/tools/indicators/11836
The PDF files number 301 (over 1,000 pages, over 350,000 characters in total).
Most of them are summaries of cases where, by using three RCI lines to logically link higher and lower timeframes, various lower-timeframe conditions are sequentially examined, ultimately waiting for a timing to buy on dips or sell on rallies on the lower timeframe (i.e., the mBDSR signal)..
Furthermore,many focus on identifying points where multiple entry reasons overlap..
In the explanations,more than 1,000 charts are used.
× ![]()


