
Important moving averages we monitor, triple top, and mBDSR (RCI two-filter) short-sell signal
Indicator 【mBDSR】 that captures “tops/bottoms and reversals” in combination with RCI
Method & Case Study (PDF) ★GogoJungle AWARD2020 winner★
https://www.gogojungle.co.jp/tools/indicators/11836
The above product includes 301 PDFs. For the list of titles of those PDFs, please see the article below.
About the 301 PDF files included with 【BODSOR・mBDSR】
https://www.gogojungle.co.jp/finance/navi/articles/34271
GBP/AUD on 5-minute chart
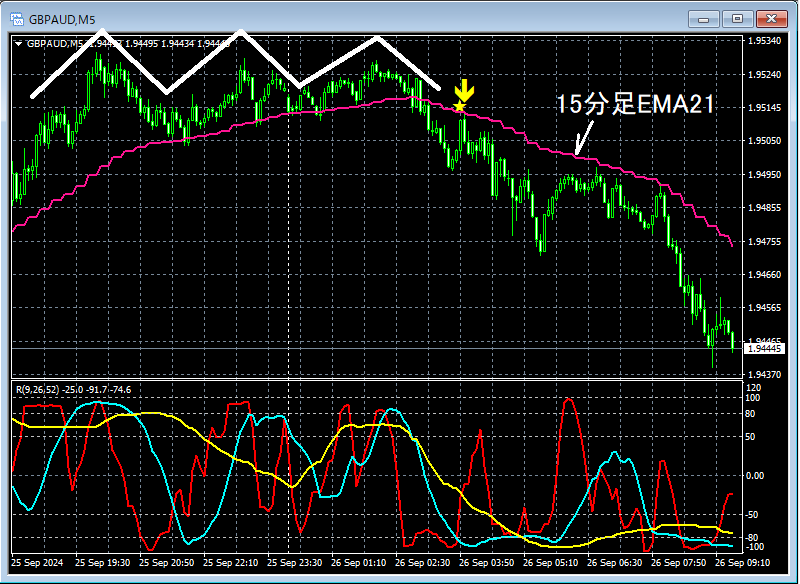
The higher-timeframe situation is omitted. On the 5-minute chart above,a triple topformed and reversed. After breaking below the15-minute EMA21which had been acting as support, price rose near that moving average,the mBDSR (RCI two-filter) short-side signallit up, and price has since moved decisively lower.
From this example,the trade methodology that focuses on key moving averages and triple topsandthe harmony with mBDSR signalsis evident.
Indicator that shines when combined with RCI: 【BODSOR・mBDSR】
Method & Case Study (PDF) ★GogoJungle AWARD2020 winner★
https://www.gogojungle.co.jp/tools/indicators/11836
The PDFs include 301 files (over 1,000 pages, over 350,000 characters in total).
Many of themdetail how to logically link the higher and lower timeframes using the RCI three-line setup, progressively analyzing multiple lower timeframes and ultimately waiting for timing to buy on dips or sell on rallies on the lower timeframes (i.e., mBDSR signals)..
Additionally,many focus on identifying points where multiple entry reasons align..
The explanations useover 1,000 charts.

Method & Case Study (PDF) ★GogoJungle AWARD2020 winner★
https://www.gogojungle.co.jp/tools/indicators/11836
The above product includes 301 PDFs. For the list of titles of those PDFs, please see the article below.
About the 301 PDF files included with 【BODSOR・mBDSR】
https://www.gogojungle.co.jp/finance/navi/articles/34271
GBP/AUD on 5-minute chart
The higher-timeframe situation is omitted. On the 5-minute chart above,a triple topformed and reversed. After breaking below the15-minute EMA21which had been acting as support, price rose near that moving average,the mBDSR (RCI two-filter) short-side signallit up, and price has since moved decisively lower.
From this example,the trade methodology that focuses on key moving averages and triple topsandthe harmony with mBDSR signalsis evident.
Indicator that shines when combined with RCI: 【BODSOR・mBDSR】
Method & Case Study (PDF) ★GogoJungle AWARD2020 winner★
https://www.gogojungle.co.jp/tools/indicators/11836
The PDFs include 301 files (over 1,000 pages, over 350,000 characters in total).
Many of themdetail how to logically link the higher and lower timeframes using the RCI three-line setup, progressively analyzing multiple lower timeframes and ultimately waiting for timing to buy on dips or sell on rallies on the lower timeframes (i.e., mBDSR signals)..
Additionally,many focus on identifying points where multiple entry reasons align..
The explanations useover 1,000 charts.