

[Today's 2024-09-26 AUD/JPY攻略] Buy signals on pullbacks using moving averages, double bottom, counter-trend line, and mBDSR (RCI 2-line filter)
Indicator that captures “tops/bottoms and reversals” with the combination of RCI【mBDSR】
and method/case studies (PDF) ★GogoJungle AWARD2020 winner★
https://www.gogojungle.co.jp/tools/indicators/11836
The above product includes 301 PDFs. For a list of the titles of those PDFs, please see the article below.
About the 301 attached PDF files for 【BODSOR・mBDSR】
https://www.gogojungle.co.jp/finance/navi/articles/34271
AUDUSD, AUDJPY, 15-minute chart
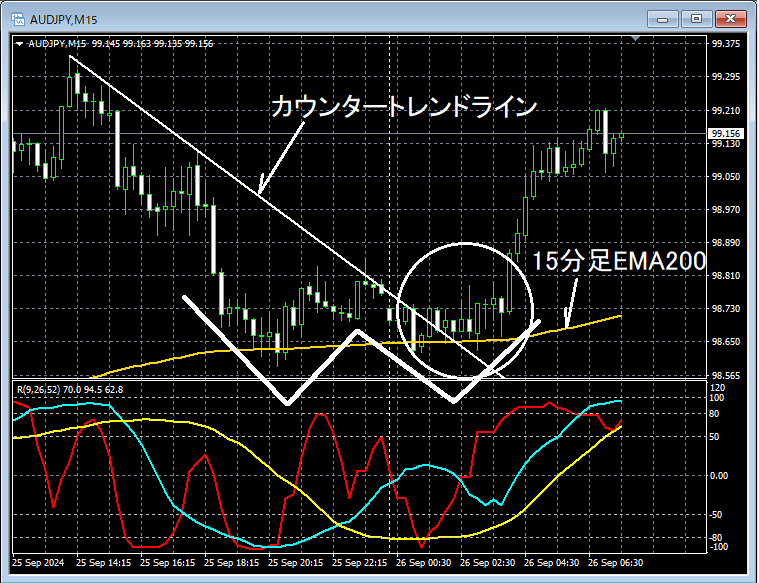
The higher timeframe situation is omitted. Looking at the area circled in white on the 15-minute chart above, this is what is being watched in this case15-minute EMA200It has retraced close to it, and at least there is a plausible scenario for a partial rebound. If it then moves higherDouble bottomforms and it rises, note that the price may go up. Here, we will examine the area circled in white in more detail on the lower timeframe.
AUDJPY, 5-minute chart
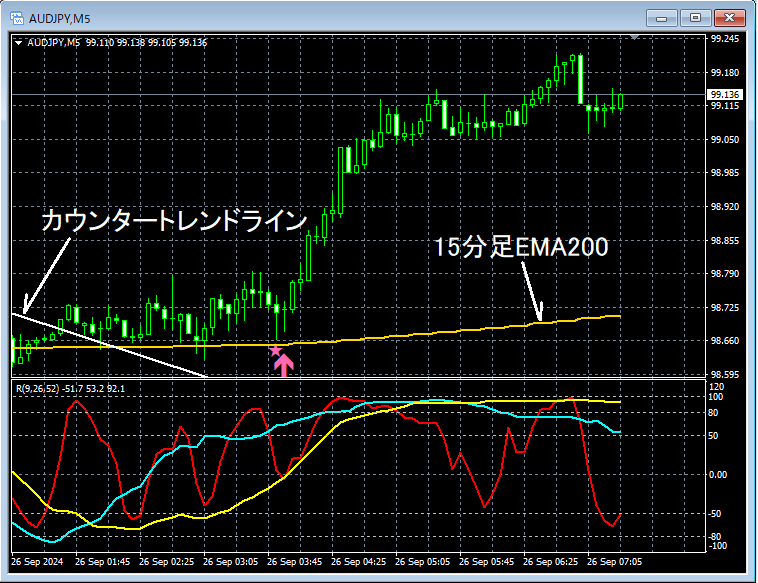
Looking at the 5-minute chart above,near the 15-minute EMA200there is a bit of a rebound tendency.Break above the counter-trend lineandmBDSR (filter: RCI26 and RCI52) pullback buy signallights up and the price is clearly rising.
From this example,the trading method focusing on moving averages, double bottoms, and counter-trend linesandthe signal of mBDSRhave a high degree of compatibility.
Additionally, in this example,a stop-loss line placed slightly below the recent lowenables a trade with favorable risk-reward.
Indicator that delivers power when combined with RCI【BODSOR・mBDSR】
and method/case studies (PDF) ★GogoJungle AWARD2020 winner★
https://www.gogojungle.co.jp/tools/indicators/11836
The PDF files include 301 files (over 1,000 pages in total, over 350,000 characters).
Most of them aresummaries of how, by logically linking higher and lower timeframes using three RCI lines, multiple lower timeframes are considered step by step, and finally wait for pullbacks in the lower timeframes (i.e., mBDSR signals) for timing of buy dips or sell rips.
In addition,many focus on identifying points where multiple entry reasons overlap.
Explanations usemore than 1,000 charts.

and method/case studies (PDF) ★GogoJungle AWARD2020 winner★
https://www.gogojungle.co.jp/tools/indicators/11836
The above product includes 301 PDFs. For a list of the titles of those PDFs, please see the article below.
About the 301 attached PDF files for 【BODSOR・mBDSR】
https://www.gogojungle.co.jp/finance/navi/articles/34271
AUDUSD, AUDJPY, 15-minute chart
The higher timeframe situation is omitted. Looking at the area circled in white on the 15-minute chart above, this is what is being watched in this case15-minute EMA200It has retraced close to it, and at least there is a plausible scenario for a partial rebound. If it then moves higherDouble bottomforms and it rises, note that the price may go up. Here, we will examine the area circled in white in more detail on the lower timeframe.
AUDJPY, 5-minute chart
Looking at the 5-minute chart above,near the 15-minute EMA200there is a bit of a rebound tendency.Break above the counter-trend lineandmBDSR (filter: RCI26 and RCI52) pullback buy signallights up and the price is clearly rising.
From this example,the trading method focusing on moving averages, double bottoms, and counter-trend linesandthe signal of mBDSRhave a high degree of compatibility.
Additionally, in this example,a stop-loss line placed slightly below the recent lowenables a trade with favorable risk-reward.
Indicator that delivers power when combined with RCI【BODSOR・mBDSR】
and method/case studies (PDF) ★GogoJungle AWARD2020 winner★
https://www.gogojungle.co.jp/tools/indicators/11836
The PDF files include 301 files (over 1,000 pages in total, over 350,000 characters).
Most of them aresummaries of how, by logically linking higher and lower timeframes using three RCI lines, multiple lower timeframes are considered step by step, and finally wait for pullbacks in the lower timeframes (i.e., mBDSR signals) for timing of buy dips or sell rips.
In addition,many focus on identifying points where multiple entry reasons overlap.
Explanations usemore than 1,000 charts.
× ![]()


