

Pin Bar, Overlap Line, Bearish Reversal Signal with Hammer and mBDSR (RCI 2-Period Filter)
0
Indicator 【mBDSR】 that captures “turning points and reversals” in combination with RCI
and methodology / case studies (PDF) ★GogoJungle AWARD2020 winner★
https://www.gogojungle.co.jp/tools/indicators/11836
The above products include 301 PDFs. For a list of their PDF titles, please see the article below.
About the 301 PDF files included with 【BODSOR・mBDSR】
https://www.gogojungle.co.jp/finance/navi/articles/34271
USDJPY Dollar/Yen 30-minute chart
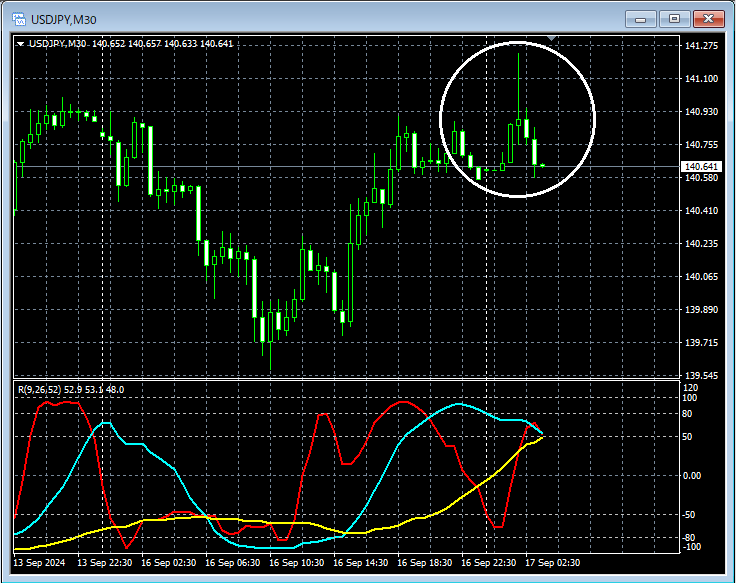
If you look at the area circled in white on the 30-minute chart above, it suggests a downtrendPin Bar(a candlestick with a long upper shadow) has appeared, and it may not be unusual to consider selling on rallies in lower timeframes. In this case,Pin Baris a pattern where traders who jumped in during strong upward movement get trapped. Public sentiment may be interpreted as turning down (bearish).
USDJPY Dollar/Yen 15-minute chart
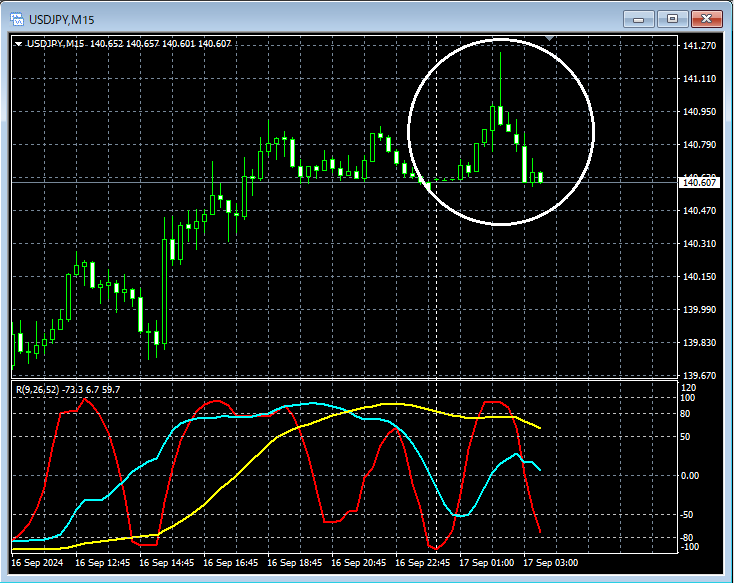
Looking at the area circled in white on the 15-minute chart above, the 30-minute chartPin Bar(the candlestick with a long upper shadow) appears to indicate a declineOverlap linehas appeared, and it may not be unusual to consider selling on rallies in lower timeframes.
USDJPY Dollar/Yen 5-minute chart
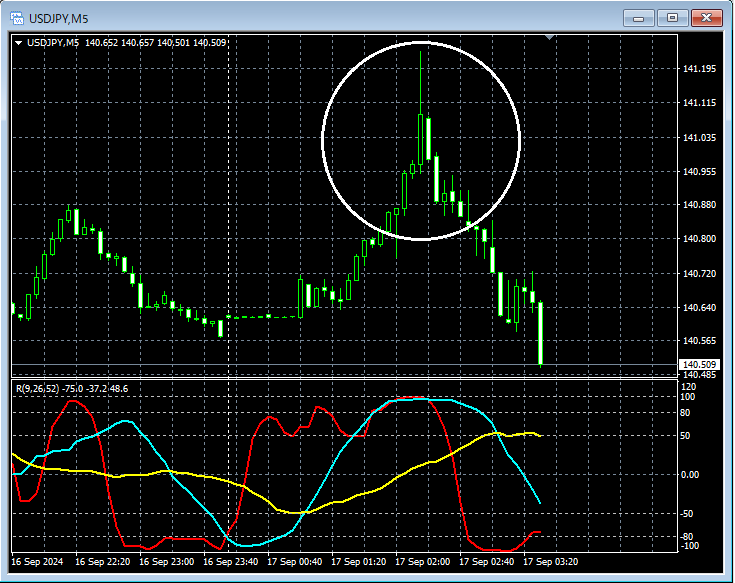
Looking at the area circled in white on the 5-minute chart above, aHarami candlehas appeared, suggesting a downtrend. Let us also check the lower timeframe.
USDJPY Dollar/Yen 1-minute chart
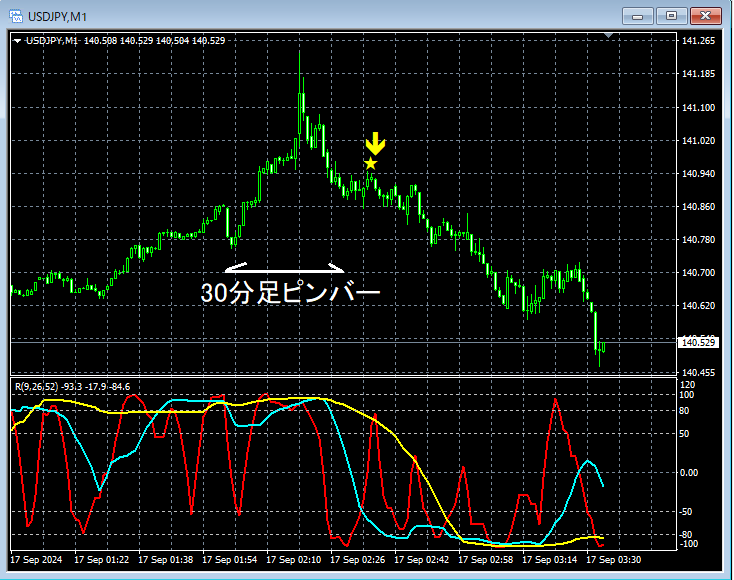
On the 1-minute chart above, together with the appearance of thePin Baron the 30-minute chart, after a decline, there is a rise,mBDSR (two RCI filters) sell signallighting up and continuing to fall.
From this example,a trading approach focusing on Pin Bars, overlap lines, and Harami candlesandthe signals of mBDSRshow strong compatibility.
Indicator that exerts power in combination with RCI【BODSOR・mBDSR】
and methodology / case studies (PDF) ★GogoJungle AWARD2020 winner★
https://www.gogojungle.co.jp/tools/indicators/11836
The PDF files include 301 PDFs (over 1,000 pages in total, over 350,000 characters in total).
Many of them are abouta scenario where RCI uses three lines to logically link higher and lower timeframes, sequentially examining multiple lower timeframes, and ultimately waiting for a timing to buy on dips or to sell on rallies (i.e., a signal from mBDSR) on the lower timeframes..
Additionally,many of them focus on capturing points where multiple entry reasons overlap..
The explanations usemore than 1,000 charts..

and methodology / case studies (PDF) ★GogoJungle AWARD2020 winner★
https://www.gogojungle.co.jp/tools/indicators/11836
The above products include 301 PDFs. For a list of their PDF titles, please see the article below.
About the 301 PDF files included with 【BODSOR・mBDSR】
https://www.gogojungle.co.jp/finance/navi/articles/34271
USDJPY Dollar/Yen 30-minute chart
If you look at the area circled in white on the 30-minute chart above, it suggests a downtrendPin Bar(a candlestick with a long upper shadow) has appeared, and it may not be unusual to consider selling on rallies in lower timeframes. In this case,Pin Baris a pattern where traders who jumped in during strong upward movement get trapped. Public sentiment may be interpreted as turning down (bearish).
USDJPY Dollar/Yen 15-minute chart
Looking at the area circled in white on the 15-minute chart above, the 30-minute chartPin Bar(the candlestick with a long upper shadow) appears to indicate a declineOverlap linehas appeared, and it may not be unusual to consider selling on rallies in lower timeframes.
USDJPY Dollar/Yen 5-minute chart
Looking at the area circled in white on the 5-minute chart above, aHarami candlehas appeared, suggesting a downtrend. Let us also check the lower timeframe.
USDJPY Dollar/Yen 1-minute chart
On the 1-minute chart above, together with the appearance of thePin Baron the 30-minute chart, after a decline, there is a rise,mBDSR (two RCI filters) sell signallighting up and continuing to fall.
From this example,a trading approach focusing on Pin Bars, overlap lines, and Harami candlesandthe signals of mBDSRshow strong compatibility.
Indicator that exerts power in combination with RCI【BODSOR・mBDSR】
and methodology / case studies (PDF) ★GogoJungle AWARD2020 winner★
https://www.gogojungle.co.jp/tools/indicators/11836
The PDF files include 301 PDFs (over 1,000 pages in total, over 350,000 characters in total).
Many of them are abouta scenario where RCI uses three lines to logically link higher and lower timeframes, sequentially examining multiple lower timeframes, and ultimately waiting for a timing to buy on dips or to sell on rallies (i.e., a signal from mBDSR) on the lower timeframes..
Additionally,many of them focus on capturing points where multiple entry reasons overlap..
The explanations usemore than 1,000 charts..
× ![]()


