

Importance of drilling down from higher timeframe candles to lower timeframe candles and the sign of mBDSR (RCI two-filter) (12)
====================
【Special Video vol.01/Blacksun】
https://www.gogojungle.co.jp/info/22955
【Special Video vol.02/Blacksun】
https://www.gogojungle.co.jp/info/22956
【Special Video vol.03/Blacksun】
https://www.gogojungle.co.jp/info/22957
====================
The MT5 Beta version has been released!!
mBDSR (Product ID 11836) Purchase Bonus】MT5 Indicator (Beta) “mBDSR (no filter, RCI filter, MA filter)”
https://www.gogojungle.co.jp/tools/indicators/56765
【Master RCI!! Trend reversal, dip buying, and pullback selling】
An indicator that excels when combined with RCI【BODSOR・mBDSR】
and method & case studies (PDF) ★GogoJungle AWARD 2020 Winner★
https://www.gogojungle.co.jp/tools/indicators/11836
CAD/JPY 15-minute chart
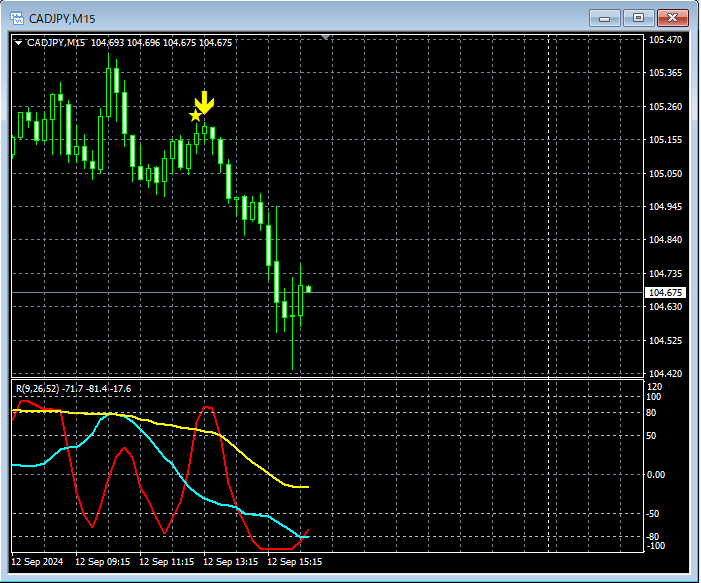
Details about the higher timeframe are omitted. Also, the explanation of drilling down from higher to lower timeframes using RCI is provided in the accompanying PDF, so that part is omitted here as well.
In actual trading, when planning a strategy, it is extremely important tounderstand the higher-timeframe situationanddrill down from higher-timeframe using RCI to lower-timeframes.
On the 15-minute chart above (the lower timeframe in this example),the mBDSR (RCI two-filter) pullback sell signallights up at a timely moment (drill-down from higher to lower timeframes using RCI, as a result we are looking at the 15-minute chart—not just randomly looking at it.)
In addition, in this example, by placing the stop-loss just above the most recent high, it is possible to achieve a good risk-reward trade (by grasping the higher-timeframe situation and drilling down using RCI from higher to lower timeframes,a favorable risk-reward tradeis achievable.)
※Please note that in the charts shown in this article, for convenience of explanation, circles, lines, and squares may be drawn.
Ind icator that shines with the combination of RCI【BODSOR・mBDSR】
and method & case studies (PDF) ★GogoJungle AWARD 2020 Winner★
https://www.gogojungle.co.jp/tools/indicators/11836
The PDF file contains 358 items (over 1,400 pages, over 470,000 characters).
Most of them aredescriptions of situations where multiple lower-timeframe entries are supported by linking higher and lower timeframes logically using the three-line RCI, and finally waiting for a pullback buy or pullback sell signals on the lower timeframes (i.e., mBDSR signals).
Additionally,many emphasize capturing points where multiple entry reasons overlap..
Also included is a method for exploring upside and downside targets using three RCI lines.
In the PDF explanation,more than 1,350 chartsare used.

【Special Video vol.01/Blacksun】
https://www.gogojungle.co.jp/info/22955
【Special Video vol.02/Blacksun】
https://www.gogojungle.co.jp/info/22956
【Special Video vol.03/Blacksun】
https://www.gogojungle.co.jp/info/22957
====================
The MT5 Beta version has been released!!
mBDSR (Product ID 11836) Purchase Bonus】MT5 Indicator (Beta) “mBDSR (no filter, RCI filter, MA filter)”
https://www.gogojungle.co.jp/tools/indicators/56765
【Master RCI!! Trend reversal, dip buying, and pullback selling】
An indicator that excels when combined with RCI【BODSOR・mBDSR】
and method & case studies (PDF) ★GogoJungle AWARD 2020 Winner★
https://www.gogojungle.co.jp/tools/indicators/11836
CAD/JPY 15-minute chart
Details about the higher timeframe are omitted. Also, the explanation of drilling down from higher to lower timeframes using RCI is provided in the accompanying PDF, so that part is omitted here as well.
In actual trading, when planning a strategy, it is extremely important tounderstand the higher-timeframe situationanddrill down from higher-timeframe using RCI to lower-timeframes.
On the 15-minute chart above (the lower timeframe in this example),the mBDSR (RCI two-filter) pullback sell signallights up at a timely moment (drill-down from higher to lower timeframes using RCI, as a result we are looking at the 15-minute chart—not just randomly looking at it.)
In addition, in this example, by placing the stop-loss just above the most recent high, it is possible to achieve a good risk-reward trade (by grasping the higher-timeframe situation and drilling down using RCI from higher to lower timeframes,a favorable risk-reward tradeis achievable.)
※Please note that in the charts shown in this article, for convenience of explanation, circles, lines, and squares may be drawn.
Ind icator that shines with the combination of RCI【BODSOR・mBDSR】
and method & case studies (PDF) ★GogoJungle AWARD 2020 Winner★
https://www.gogojungle.co.jp/tools/indicators/11836
The PDF file contains 358 items (over 1,400 pages, over 470,000 characters).
Most of them aredescriptions of situations where multiple lower-timeframe entries are supported by linking higher and lower timeframes logically using the three-line RCI, and finally waiting for a pullback buy or pullback sell signals on the lower timeframes (i.e., mBDSR signals).
Additionally,many emphasize capturing points where multiple entry reasons overlap..
Also included is a method for exploring upside and downside targets using three RCI lines.
In the PDF explanation,more than 1,350 chartsare used.
× ![]()


