

From yesterday's (September 11, 2024) dollar-yen chart: the importance of dropping from higher timeframes to lower timeframes and the signal of mBDSR (RCI two-filter)
0
Indicator that captures tops and bottoms and reversals in combination with RCI 【mBDSR】
Methods, case studies (PDF) ★GogoJungle AWARD2020 Winner★
https://www.gogojungle.co.jp/tools/indicators/11836
The above products include 301 PDFs. For lists of the PDF titles and related information, please refer to the article below.
About the 301 PDF files accompanying 【BODSOR・mBDSR】
https://www.gogojungle.co.jp/finance/navi/articles/34271
USDJPY 30-minute chart
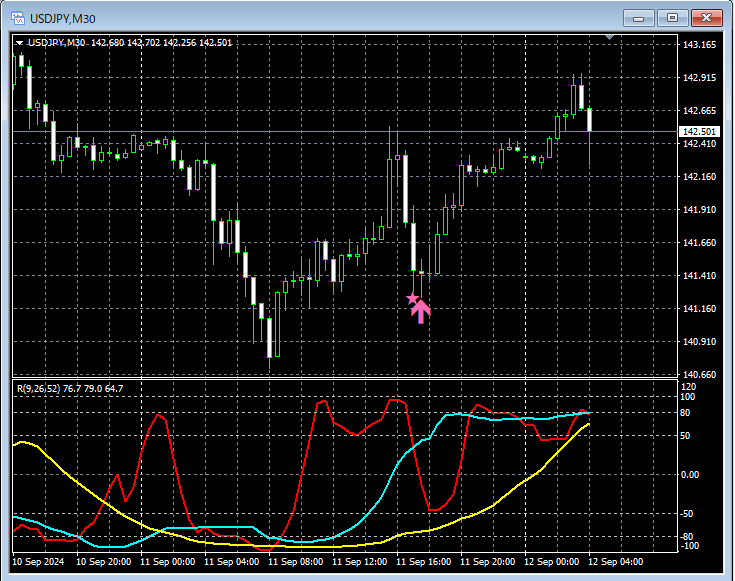
Regarding the higher time frame, it is omitted. Also, the detailed explanation of drilling down from higher to lower time frames using RCI is provided in the accompanying PDFs, so it is omitted here as well.
In actual trading, when formulating a strategy,awareness of the higher time frameanddrilling down from higher to lower time frames using RCIare extremely important.
On the upper 30-minute chart (the lower time frame in this context),the mBDSR (RCI two-filter) pullback-buy signalis clearly lighting up at the right moment.
Indicator that shines in combination with RCI: 【BODSOR・mBDSR】
Methods, case studies (PDF) ★GogoJungle AWARD2020 Winner★
https://www.gogojungle.co.jp/tools/indicators/11836
The PDF files include 301 PDFs (over 1,000 pages, over 350,000 characters in total).
Many of them are examples that break down by logically linking higher and lower time frames using three RCI lines, sequentially examining the multiple lower time frames, and finally waiting for pullbacks or pullback sells (the mBDSR signals) on the lower time frameas the outcome.
Also,many focus on identifying points where multiple entry rationale coincide.
In the explanations,more than 1,000 chartsare used.

Methods, case studies (PDF) ★GogoJungle AWARD2020 Winner★
https://www.gogojungle.co.jp/tools/indicators/11836
The above products include 301 PDFs. For lists of the PDF titles and related information, please refer to the article below.
About the 301 PDF files accompanying 【BODSOR・mBDSR】
https://www.gogojungle.co.jp/finance/navi/articles/34271
USDJPY 30-minute chart
Regarding the higher time frame, it is omitted. Also, the detailed explanation of drilling down from higher to lower time frames using RCI is provided in the accompanying PDFs, so it is omitted here as well.
In actual trading, when formulating a strategy,awareness of the higher time frameanddrilling down from higher to lower time frames using RCIare extremely important.
On the upper 30-minute chart (the lower time frame in this context),the mBDSR (RCI two-filter) pullback-buy signalis clearly lighting up at the right moment.
Indicator that shines in combination with RCI: 【BODSOR・mBDSR】
Methods, case studies (PDF) ★GogoJungle AWARD2020 Winner★
https://www.gogojungle.co.jp/tools/indicators/11836
The PDF files include 301 PDFs (over 1,000 pages, over 350,000 characters in total).
Many of them are examples that break down by logically linking higher and lower time frames using three RCI lines, sequentially examining the multiple lower time frames, and finally waiting for pullbacks or pullback sells (the mBDSR signals) on the lower time frameas the outcome.
Also,many focus on identifying points where multiple entry rationale coincide.
In the explanations,more than 1,000 chartsare used.
× ![]()


