

Elliott Wave and R1R2S2 signals
============
【Special Video vol.01/Blacksun】
https://www.gogojungle.co.jp/info/22955
【Special Video vol.02/Blacksun】
https://www.gogojungle.co.jp/info/22956
【Special Video vol.03/Blacksun】
https://www.gogojungle.co.jp/info/22957
============
【Master RCI!! Trend Reversal, Buy on Dips, Sell on Rallies】
Indicator that shines when combined with RCI【BODSOR・mBDSR】
and methodology/case studies (PDF) ★GogoJungle AWARD2020 winner★
https://www.gogojungle.co.jp/tools/indicators/11836
R1R2S2 is included in the above products. For details, please read the Investment Guide+ article below.
RCI 3-line “Two-stage Confirmation” to target trend reversals, buying on dips, and selling on rallies – Release of “R1R2S2”
New Zealand Yen NZDJPY 15-minute chart
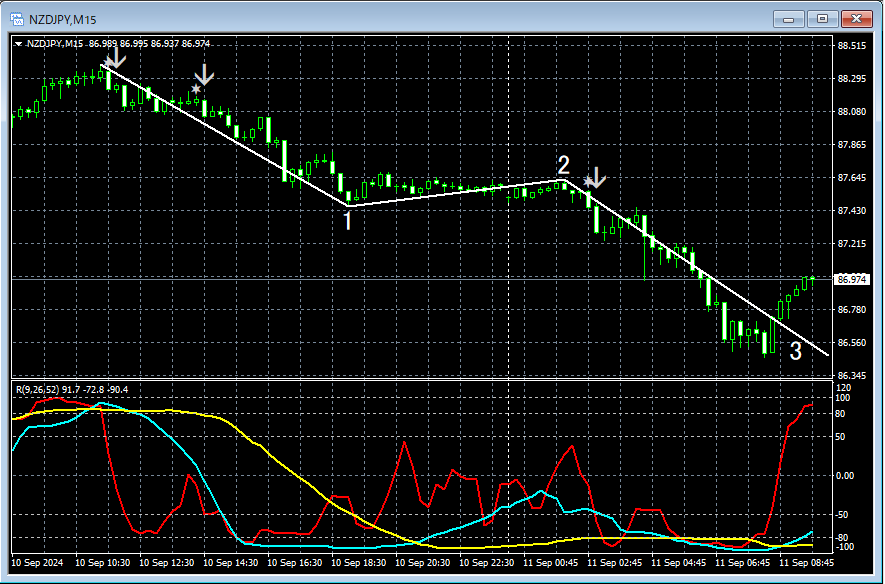
On the 15-minute chart, theElliott Waveis displayed on the 5-minute chart.Descending Wave 1 and Wave 3aresignaled to sell by R1R2S2three times, and the price declined.
From this example,a trading method focused on Elliott Waveandthe signals of R1R2S2show high compatibility.
※Please note that for convenience in explanation, charts in this article may have been annotated with circles, lines, or boxes.
Indicators that shine when combined with RCI【BODSOR・mBDSR】
and methodology/case studies (PDF) ★GogoJungle AWARD2020 winner★
https://www.gogojungle.co.jp/tools/indicators/11836
The PDF file contains 358 files (over 1,400 pages, over 470,000 characters in total).
Most of them describe the process of logically linking higher and lower timeframes using the RCI 3-line setup, examining multiple lower-timeframe conditions in sequence, and ultimately waiting for buy-on-dips or sell-on-rallies timing (the mBDSR signal) on the lower timeframe.
Additionally,many focus on identifying points where multiple entry reasons overlap.There are also many sections that explore methods for probing upward and downward targets using the RCI 3-line setup.
In the PDF explanations,more than 1,350 chartsare used.

【Special Video vol.01/Blacksun】
https://www.gogojungle.co.jp/info/22955
【Special Video vol.02/Blacksun】
https://www.gogojungle.co.jp/info/22956
【Special Video vol.03/Blacksun】
https://www.gogojungle.co.jp/info/22957
============
【Master RCI!! Trend Reversal, Buy on Dips, Sell on Rallies】
Indicator that shines when combined with RCI【BODSOR・mBDSR】
and methodology/case studies (PDF) ★GogoJungle AWARD2020 winner★
https://www.gogojungle.co.jp/tools/indicators/11836
R1R2S2 is included in the above products. For details, please read the Investment Guide+ article below.
RCI 3-line “Two-stage Confirmation” to target trend reversals, buying on dips, and selling on rallies – Release of “R1R2S2”
New Zealand Yen NZDJPY 15-minute chart
On the 15-minute chart, theElliott Waveis displayed on the 5-minute chart.Descending Wave 1 and Wave 3aresignaled to sell by R1R2S2three times, and the price declined.
From this example,a trading method focused on Elliott Waveandthe signals of R1R2S2show high compatibility.
※Please note that for convenience in explanation, charts in this article may have been annotated with circles, lines, or boxes.
Indicators that shine when combined with RCI【BODSOR・mBDSR】
and methodology/case studies (PDF) ★GogoJungle AWARD2020 winner★
https://www.gogojungle.co.jp/tools/indicators/11836
The PDF file contains 358 files (over 1,400 pages, over 470,000 characters in total).
Most of them describe the process of logically linking higher and lower timeframes using the RCI 3-line setup, examining multiple lower-timeframe conditions in sequence, and ultimately waiting for buy-on-dips or sell-on-rallies timing (the mBDSR signal) on the lower timeframe.
Additionally,many focus on identifying points where multiple entry reasons overlap.There are also many sections that explore methods for probing upward and downward targets using the RCI 3-line setup.
In the PDF explanations,more than 1,350 chartsare used.
× ![]()


