

Break above the previous high and break below the push low and the signal of mBDSR (RCI 2-line filter)
==============================
【Special Video vol.01/Blacksun】
https://www.gogojungle.co.jp/info/22955
【Special Video vol.02/Blacksun】
https://www.gogojungle.co.jp/info/22956
【Special Video vol.03/Blacksun】
https://www.gogojungle.co.jp/info/22957
==============================
The MT5 Version Beta has been released!!
mBDSR (Product ID 11836) Purchase Bonus】MT5 Indicator Software (Beta) “mBDSR (No Filter, RCI Filter, MA Filter)”
https://www.gogojungle.co.jp/tools/indicators/56765
【Master RCI!! Trend Reversal, Buy on Dips, Sell on Rallies】
An indicator with strong performance when combined with RCI, 【BODSOR・mBDSR】
and techniques / case studies (PDF) ★GogoJungle AWARD2020 Winner★
https://www.gogojungle.co.jp/tools/indicators/11836
EUR/AUD 5-minute chart
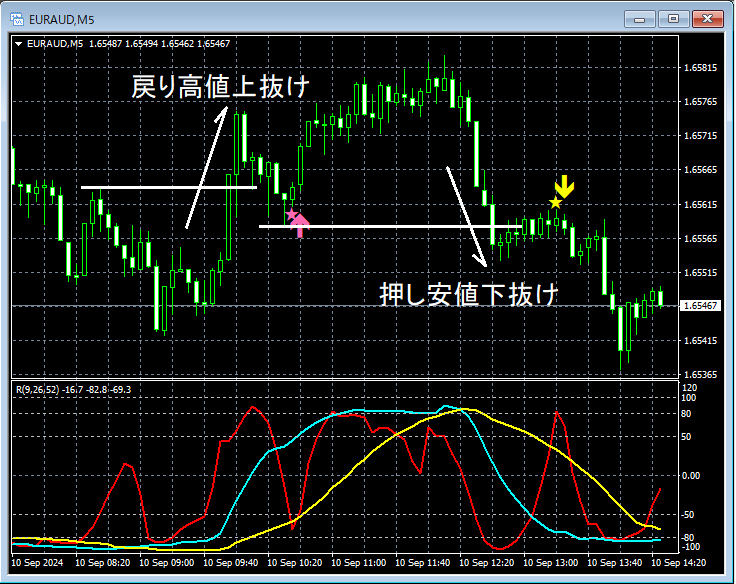
On the 5-minute chart above,the signal to buy on dips appears after breaking above the recent highand the price rises.Also, afterward,the signal to sell on rallies appears after breaking below the recent lowand the price declines.
From this example,the compatibility of Dow Theory (watching swing highs and swing lows) with the mBDSR signals is evident.Andthe harmony with mBDSR signalsis noticeable.
※ Please note that the charts shown in this article may include circles, lines, and rectangles for explanatory convenience.
An indicator that shines when combined with RCI【BODSOR・mBDSR】
and techniques / case studies (PDF) ★GogoJungle AWARD2020 Winner★
https://www.gogojungle.co.jp/tools/indicators/11836
The PDF file includes 358 files (over 1,400 pages, over 470,000 characters in total).
Most of them are structured to examine multiple lower timeframes by logically linking higher and lower timeframes using three RCI lines, ultimately waiting for a dip-buy or reversal-sell timing on the lower timeframe (the mBDSR signal).In addition,
many entries focus on identifying points where multiple entry signals converge.There are also many cases exploring methods using three RCI lines to identify upward and downward targets.
In the PDF explanations,
more than 1,350 chartsare used.

【Special Video vol.01/Blacksun】
https://www.gogojungle.co.jp/info/22955
【Special Video vol.02/Blacksun】
https://www.gogojungle.co.jp/info/22956
【Special Video vol.03/Blacksun】
https://www.gogojungle.co.jp/info/22957
==============================
The MT5 Version Beta has been released!!
mBDSR (Product ID 11836) Purchase Bonus】MT5 Indicator Software (Beta) “mBDSR (No Filter, RCI Filter, MA Filter)”
https://www.gogojungle.co.jp/tools/indicators/56765
【Master RCI!! Trend Reversal, Buy on Dips, Sell on Rallies】
An indicator with strong performance when combined with RCI, 【BODSOR・mBDSR】
and techniques / case studies (PDF) ★GogoJungle AWARD2020 Winner★
https://www.gogojungle.co.jp/tools/indicators/11836
EUR/AUD 5-minute chart
On the 5-minute chart above,the signal to buy on dips appears after breaking above the recent highand the price rises.Also, afterward,the signal to sell on rallies appears after breaking below the recent lowand the price declines.
From this example,the compatibility of Dow Theory (watching swing highs and swing lows) with the mBDSR signals is evident.Andthe harmony with mBDSR signalsis noticeable.
※ Please note that the charts shown in this article may include circles, lines, and rectangles for explanatory convenience.
An indicator that shines when combined with RCI【BODSOR・mBDSR】
and techniques / case studies (PDF) ★GogoJungle AWARD2020 Winner★
https://www.gogojungle.co.jp/tools/indicators/11836
The PDF file includes 358 files (over 1,400 pages, over 470,000 characters in total).
Most of them are structured to examine multiple lower timeframes by logically linking higher and lower timeframes using three RCI lines, ultimately waiting for a dip-buy or reversal-sell timing on the lower timeframe (the mBDSR signal).In addition,
many entries focus on identifying points where multiple entry signals converge.There are also many cases exploring methods using three RCI lines to identify upward and downward targets.
In the PDF explanations,
more than 1,350 chartsare used.
× ![]()


