

Previous high of the upper leg and return-sell signal (RCI2-band filter with mBDSR two lines) of the last time
========================
【Special Video vol.01/Blacksun】
https://www.gogojungle.co.jp/info/22955
【Special Video vol.02/Blacksun】
https://www.gogojungle.co.jp/info/22956
【Special Video vol.03/Blacksun】
https://www.gogojungle.co.jp/info/22957
========================
【MT5 Version Beta】 has been released!!
mBDSR (Product ID 11836) Purchase Bonus】 MT5 Indicator (Beta) “mBDSR (no filter, RCI filter, MA filter)”
https://www.gogojungle.co.jp/tools/indicators/56765
【Master RCI!! Trend Reversal, Buy on Dips, Sell on Rallies】
An indicator that shines when used in combination with RCI: BODSOR・mBDSR
and the methods and case studies (PDF) ★GogoJungle AWARD2020 winner★
https://www.gogojungle.co.jp/tools/indicators/11836
AUDUSD/JPY 1-hour chart
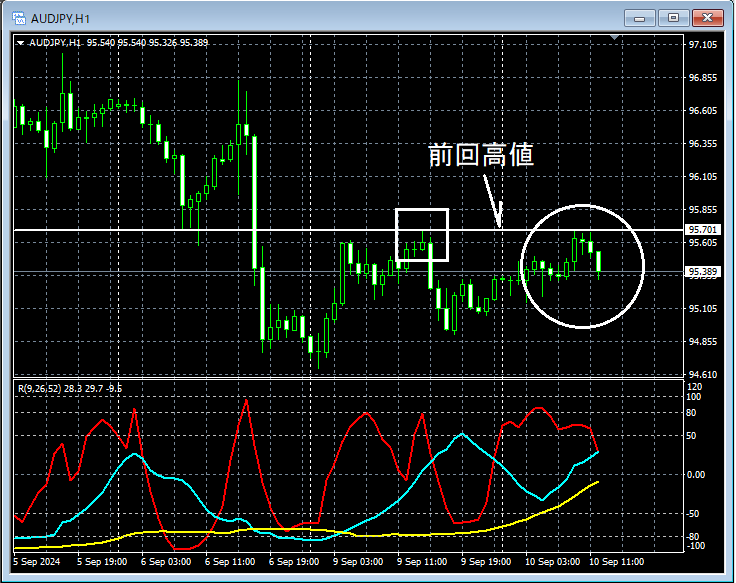
If you look at the area circled in white on the 1-hour chart abovethe line indicating the previous high (horizontal line)has risen nearby. If this line is perceived as a resistance level, it may be a scene where selling back into the move could be reasonable. I will carefully watch for signs of a reversal on lower timeframes.
AUDJPY 5-minute chart
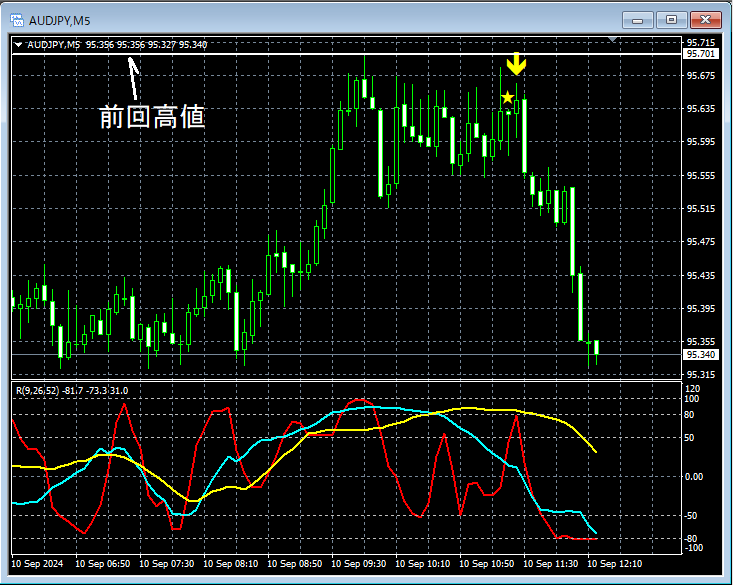
Looking at the 5-minute chart above,the line indicating the previous high on the 1-hour levelreverses nearby,mBDSR (RCI with two filters) sell signallights up, and the price continues to decline.
From this example,a trading method focused on the previous high (horizontal line)andthe signals of mBDSRshow strong compatibility.
Also in this example, by placing the stop loss slightly above the recent highthe trade can have favorable risk-reward advantagesand a higher probability of favorable outcomes.
※Please note that the charts mentioned in this article may include added annotations such as circles, straight lines, or squares for explanatory purposes.
Indicator that shines when used with RCI: 【BODSOR・mBDSR】
and the methods and case studies (PDF) ★GogoJungle AWARD2020 winner★
https://www.gogojungle.co.jp/tools/indicators/11836
The PDF file includes 358 files (over 1,400 pages, over 470,000 characters).
Many of them are designed to logically link higher and lower timeframes using three RCI lines, examining multiple lower-timeframe scenarios step by step, and ultimately waiting for dips or pullbacks signals on lower timeframes (the mBDSR signal).
In addition,there are many resources that emphasize identifying points where multiple entry reasons coincide.Also included are methods that look for potential upward and downward targets using three RCI lines.
In the PDF explanations,over 1,350 charts are used..

【Special Video vol.01/Blacksun】
https://www.gogojungle.co.jp/info/22955
【Special Video vol.02/Blacksun】
https://www.gogojungle.co.jp/info/22956
【Special Video vol.03/Blacksun】
https://www.gogojungle.co.jp/info/22957
========================
【MT5 Version Beta】 has been released!!
mBDSR (Product ID 11836) Purchase Bonus】 MT5 Indicator (Beta) “mBDSR (no filter, RCI filter, MA filter)”
https://www.gogojungle.co.jp/tools/indicators/56765
【Master RCI!! Trend Reversal, Buy on Dips, Sell on Rallies】
An indicator that shines when used in combination with RCI: BODSOR・mBDSR
and the methods and case studies (PDF) ★GogoJungle AWARD2020 winner★
https://www.gogojungle.co.jp/tools/indicators/11836
AUDUSD/JPY 1-hour chart
If you look at the area circled in white on the 1-hour chart abovethe line indicating the previous high (horizontal line)has risen nearby. If this line is perceived as a resistance level, it may be a scene where selling back into the move could be reasonable. I will carefully watch for signs of a reversal on lower timeframes.
AUDJPY 5-minute chart
Looking at the 5-minute chart above,the line indicating the previous high on the 1-hour levelreverses nearby,mBDSR (RCI with two filters) sell signallights up, and the price continues to decline.
From this example,a trading method focused on the previous high (horizontal line)andthe signals of mBDSRshow strong compatibility.
Also in this example, by placing the stop loss slightly above the recent highthe trade can have favorable risk-reward advantagesand a higher probability of favorable outcomes.
※Please note that the charts mentioned in this article may include added annotations such as circles, straight lines, or squares for explanatory purposes.
Indicator that shines when used with RCI: 【BODSOR・mBDSR】
and the methods and case studies (PDF) ★GogoJungle AWARD2020 winner★
https://www.gogojungle.co.jp/tools/indicators/11836
The PDF file includes 358 files (over 1,400 pages, over 470,000 characters).
Many of them are designed to logically link higher and lower timeframes using three RCI lines, examining multiple lower-timeframe scenarios step by step, and ultimately waiting for dips or pullbacks signals on lower timeframes (the mBDSR signal).
In addition,there are many resources that emphasize identifying points where multiple entry reasons coincide.Also included are methods that look for potential upward and downward targets using three RCI lines.
In the PDF explanations,over 1,350 charts are used..
× ![]()


