

【Yesterday (September 9, 2024) Euro/US Dollar】Sign of mBDSR (Moving Average Filter) to chase the trend
Indicator that captures “tops/bottoms and reversals” in combination with RCI【mBDSR】
Methods and Case Studies (PDF) ★GogoJungle AWARD2020 winner★
https://www.gogojungle.co.jp/tools/indicators/11836
The above products include 301 PDFs (methods, case studies, etc.). For a list of the titles of those PDFs, please refer to the article below.
About the 301 PDF files included with 【BODSOR/mBDSR】
https://www.gogojungle.co.jp/finance/navi/articles/34271
mBDSR (RCI filter)andmBDSR (Moving Average filter)serve different roles. The usage distinctions are also discussed in the above PDF.
Below,mBDSR (Moving Average filter)sign examples are introduced.
EUR/USD – Euro Dollar – 1 hourly chart
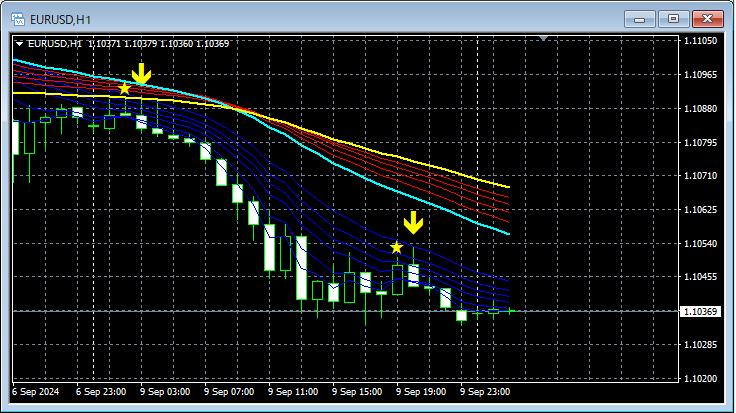
Sign with mBDSR (two moving average filters)andGMMA
An indicator that shines when combined with RCI: 【BODSOR・mBDSR】
Methods and Case Studies (PDF) ★GogoJungle AWARD2020 winner★
https://www.gogojungle.co.jp/tools/indicators/11836
The PDF files come with 301 files (over 1,000 pages, over 350,000 characters in total).
Many of them describe gathering multiple lower time-frame conditions by logically linking higher and lower time frames using the three RCI lines, ultimately falling into a pattern of waiting for pullback buys or pullback sells on the lower time frame as the mBDSR signalin a summarized form.
Additionally,many of them focus on identifying points where multiple entry reasons coincide.There are many such explanations.
A total ofover 1,000 chartsare used in the explanations.

Methods and Case Studies (PDF) ★GogoJungle AWARD2020 winner★
https://www.gogojungle.co.jp/tools/indicators/11836
The above products include 301 PDFs (methods, case studies, etc.). For a list of the titles of those PDFs, please refer to the article below.
About the 301 PDF files included with 【BODSOR/mBDSR】
https://www.gogojungle.co.jp/finance/navi/articles/34271
mBDSR (RCI filter)andmBDSR (Moving Average filter)serve different roles. The usage distinctions are also discussed in the above PDF.
Below,mBDSR (Moving Average filter)sign examples are introduced.
EUR/USD – Euro Dollar – 1 hourly chart
Sign with mBDSR (two moving average filters)andGMMA
An indicator that shines when combined with RCI: 【BODSOR・mBDSR】
Methods and Case Studies (PDF) ★GogoJungle AWARD2020 winner★
https://www.gogojungle.co.jp/tools/indicators/11836
The PDF files come with 301 files (over 1,000 pages, over 350,000 characters in total).
Many of them describe gathering multiple lower time-frame conditions by logically linking higher and lower time frames using the three RCI lines, ultimately falling into a pattern of waiting for pullback buys or pullback sells on the lower time frame as the mBDSR signalin a summarized form.
Additionally,many of them focus on identifying points where multiple entry reasons coincide.There are many such explanations.
A total ofover 1,000 chartsare used in the explanations.
× ![]()


