

Pin Bar (candlestick with a long lower wick) and Retracement High and mBDSR (RCI2 double filter) Buy Signal
=============================
【Special Video vol.01/Blacksun】
https://www.gogojungle.co.jp/info/22955
【Special Video vol.02/Blacksun】
https://www.gogojungle.co.jp/info/22956
【Special Video vol.03/Blacksun】
https://www.gogojungle.co.jp/info/22957
=============================
【MT5 version Beta】 has been released!!
mBDSR (Product ID 11836) Purchase Bonus】MT5 version Indicator (Beta) “mBDSR (no filters, RCI filter, MA filter)”
https://www.gogojungle.co.jp/tools/indicators/56765
【Master RCI!! Trend Reversal, Buy on Dips, Sell on Rallies】
An indicator that shines when combined with RCI【BODSOR・mBDSR】
and methods & case studies (PDF) ★GogoJungle AWARD2020 Winner★
https://www.gogojungle.co.jp/tools/indicators/11836
GBPJPY 1-hour chart
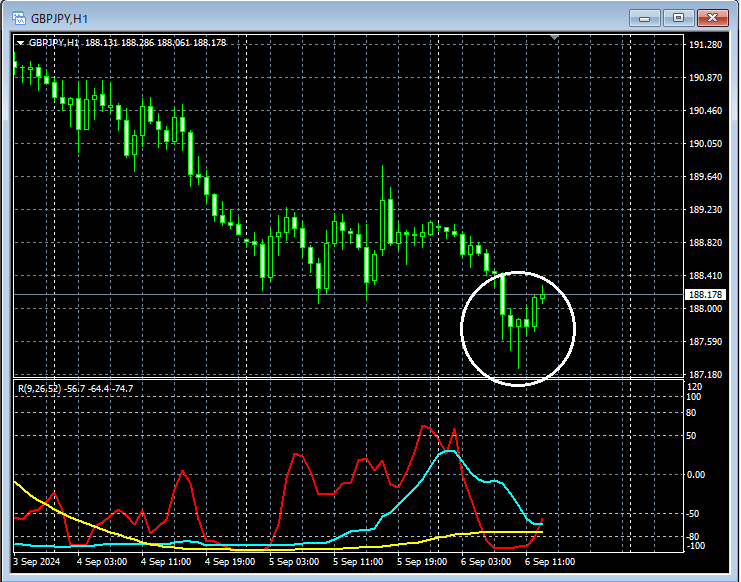
Looking at the area circled in white on the 1-hour chart above, it suggests an upward movementPin Bar (candlestick with a long lower wick)is appearing. It may not be unusual to consider a dip-buy strategy on lower timeframes.
GBPJPY 5-minute chart
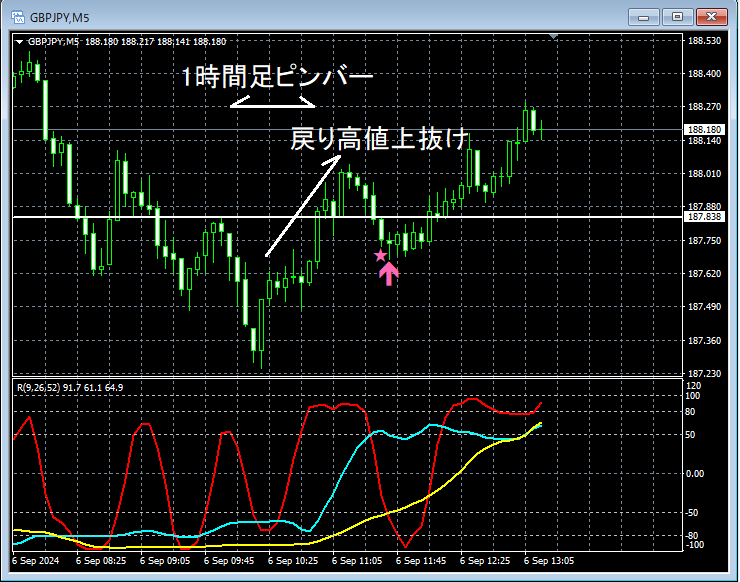
On the above 5-minute chart, thePin Bar (long lower wick) on the hourly chartis accompanied by an upward breakout of the recovery highand pricecontinues to rise,mBDSR (RCI two-filter) dip-buy signallights up and price remains firmly higher.
From this example,there is a strong synergy between Dow Theory or pin bar (long lower wick) based trading methodsandthe signals of mBDSR.
※ Please note that in the charts introduced in this article, for ease of explanation, circles, lines, and squares may be drawn.
The powerful combination: indicators【BODSOR・mBDSR】 with RCI
and methods & case studies (PDF) ★GogoJungle AWARD2020 Winner★
https://www.gogojungle.co.jp/tools/indicators/11836
The PDF file comes with 358 items (over 1,400 pages, over 470,000 characters).
Most of these are compiled into an approach that links multiple lower timeframes logically with higher timeframes using three RCI lines, ultimately waiting for dip-buying or pullback-selling signals on the lower timeframes (i.e., mBDSR signals).
Additionally,many entries focus on identifying points where multiple entry rationales align.There are many such cases.
Furthermore,there are methods exploring upside targets and downside targets using three RCI lines.Also included.
In the PDF explanations,more than 1,350 chartsare used.

【Special Video vol.01/Blacksun】
https://www.gogojungle.co.jp/info/22955
【Special Video vol.02/Blacksun】
https://www.gogojungle.co.jp/info/22956
【Special Video vol.03/Blacksun】
https://www.gogojungle.co.jp/info/22957
=============================
【MT5 version Beta】 has been released!!
mBDSR (Product ID 11836) Purchase Bonus】MT5 version Indicator (Beta) “mBDSR (no filters, RCI filter, MA filter)”
https://www.gogojungle.co.jp/tools/indicators/56765
【Master RCI!! Trend Reversal, Buy on Dips, Sell on Rallies】
An indicator that shines when combined with RCI【BODSOR・mBDSR】
and methods & case studies (PDF) ★GogoJungle AWARD2020 Winner★
https://www.gogojungle.co.jp/tools/indicators/11836
GBPJPY 1-hour chart
Looking at the area circled in white on the 1-hour chart above, it suggests an upward movementPin Bar (candlestick with a long lower wick)is appearing. It may not be unusual to consider a dip-buy strategy on lower timeframes.
GBPJPY 5-minute chart
On the above 5-minute chart, thePin Bar (long lower wick) on the hourly chartis accompanied by an upward breakout of the recovery highand pricecontinues to rise,mBDSR (RCI two-filter) dip-buy signallights up and price remains firmly higher.
From this example,there is a strong synergy between Dow Theory or pin bar (long lower wick) based trading methodsandthe signals of mBDSR.
※ Please note that in the charts introduced in this article, for ease of explanation, circles, lines, and squares may be drawn.
The powerful combination: indicators【BODSOR・mBDSR】 with RCI
and methods & case studies (PDF) ★GogoJungle AWARD2020 Winner★
https://www.gogojungle.co.jp/tools/indicators/11836
The PDF file comes with 358 items (over 1,400 pages, over 470,000 characters).
Most of these are compiled into an approach that links multiple lower timeframes logically with higher timeframes using three RCI lines, ultimately waiting for dip-buying or pullback-selling signals on the lower timeframes (i.e., mBDSR signals).
Additionally,many entries focus on identifying points where multiple entry rationales align.There are many such cases.
Furthermore,there are methods exploring upside targets and downside targets using three RCI lines.Also included.
In the PDF explanations,more than 1,350 chartsare used.
× ![]()


