

Key number alert, Bollinger Bands, and mBDSR (RCI double filter) bullish signal
============
【Special Video vol.01/Blacksun】
https://www.gogojungle.co.jp/info/22955
【Special Video vol.02/Blacksun】
https://www.gogojungle.co.jp/info/22956
【Special Video vol.03/Blacksun】
https://www.gogojungle.co.jp/info/22957
============
The MT5 Version Beta version has been released!!
mBDSR (Product ID 11836) Purchase Benefit: MT5 Version Indicator (Beta) “mBDSR (no filter, RCI filter, MA filter)”
https://www.gogojungle.co.jp/tools/indicators/56765
【Master RCI!! Trend reversal, buy on dips, sell on rallies】
Indicator that excels when used in combination with RCI【BODSOR・mBDSR】
and methodology & case studies (PDF) ★GogoJungle AWARD2020 recipient★
https://www.gogojungle.co.jp/tools/indicators/11836
USD/JPY 5-minute chart
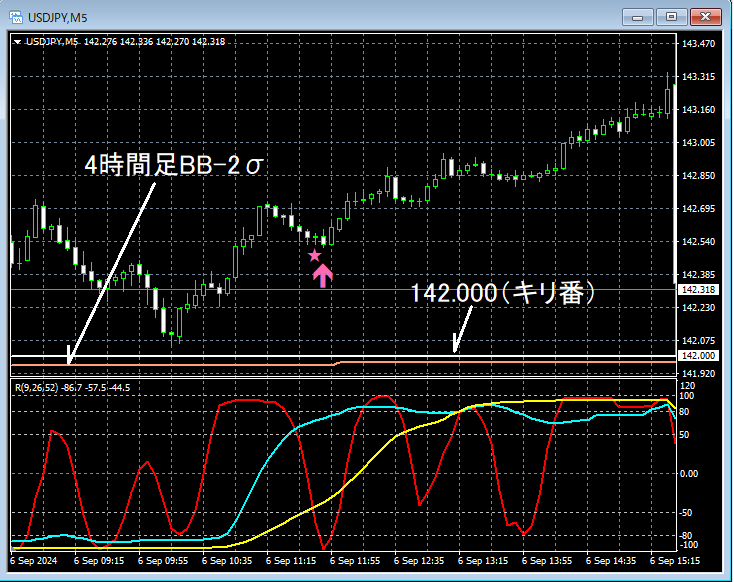
The conditions of the higher time frame are omitted. On the 5-minute chart above, it can also be a psychological milestoneround number (in this case, 142.000)andthe 4-hour Bollinger Band (-2σ)overlap, causing a slight rebound. Thenthe buy-the-dips signal of mBDSR (RCI two-filters) is litand price subsequently moves higher steadily.
From this example,the high compatibility between round numbers (key numbers) or Bollinger Bands trading methodsandthe signals of mBDSRis evident.
※Please note that in the charts introduced in this article, circles, lines, and squares may be drawn for ease of explanation.
Indicator that excels when combined with RCI: 【BODSOR・mBDSR】
and methodology & case studies (PDF) ★GogoJungle AWARD2020 winner★
https://www.gogojungle.co.jp/tools/indicators/11836
The PDF file includes 358 files (over 1,400 pages, over 470,000 characters).
Many of them are designed to logically link the higher and lower time frames using three RCI lines, examining multiple lower-time-frame conditions in sequence, and finally waiting for swing-ready buy dips or pullbacks on the lower time frame (i.e., mBDSR signals).
Also,many focus on identifying points where multiple entry reasons coincide.There are also many that explore pathways for rising or falling targets using three RCI lines.
Additionally,the technique to explore upside or downside targets using three RCI lines is included..
In describing the PDF files,more than 1,350 chartsare used.

【Special Video vol.01/Blacksun】
https://www.gogojungle.co.jp/info/22955
【Special Video vol.02/Blacksun】
https://www.gogojungle.co.jp/info/22956
【Special Video vol.03/Blacksun】
https://www.gogojungle.co.jp/info/22957
============
The MT5 Version Beta version has been released!!
mBDSR (Product ID 11836) Purchase Benefit: MT5 Version Indicator (Beta) “mBDSR (no filter, RCI filter, MA filter)”
https://www.gogojungle.co.jp/tools/indicators/56765
【Master RCI!! Trend reversal, buy on dips, sell on rallies】
Indicator that excels when used in combination with RCI【BODSOR・mBDSR】
and methodology & case studies (PDF) ★GogoJungle AWARD2020 recipient★
https://www.gogojungle.co.jp/tools/indicators/11836
USD/JPY 5-minute chart
The conditions of the higher time frame are omitted. On the 5-minute chart above, it can also be a psychological milestoneround number (in this case, 142.000)andthe 4-hour Bollinger Band (-2σ)overlap, causing a slight rebound. Thenthe buy-the-dips signal of mBDSR (RCI two-filters) is litand price subsequently moves higher steadily.
From this example,the high compatibility between round numbers (key numbers) or Bollinger Bands trading methodsandthe signals of mBDSRis evident.
※Please note that in the charts introduced in this article, circles, lines, and squares may be drawn for ease of explanation.
Indicator that excels when combined with RCI: 【BODSOR・mBDSR】
and methodology & case studies (PDF) ★GogoJungle AWARD2020 winner★
https://www.gogojungle.co.jp/tools/indicators/11836
The PDF file includes 358 files (over 1,400 pages, over 470,000 characters).
Many of them are designed to logically link the higher and lower time frames using three RCI lines, examining multiple lower-time-frame conditions in sequence, and finally waiting for swing-ready buy dips or pullbacks on the lower time frame (i.e., mBDSR signals).
Also,many focus on identifying points where multiple entry reasons coincide.There are also many that explore pathways for rising or falling targets using three RCI lines.
Additionally,the technique to explore upside or downside targets using three RCI lines is included..
In describing the PDF files,more than 1,350 chartsare used.
× ![]()


