

The five methods of Sakata: "Morning Star" and the R1R2S2 pullback buying signal (1)
【Mastering RCI!! Trend Reversal, Buy the Dip, Sell the Rally】
Indicator that shines when used with RCI: 【BODSOR・mBDSR】
and method・case studies (PDF) ★GogoJungle AWARD2020 Winner★
https://www.gogojungle.co.jp/tools/indicators/11836
R1R2S2 is included in the above product. For details, please see the article below in Investment Navigator+.
RCI 3-line “Two-Stage Confirmation” Indicator “R1R2S2” Release!! Targeting trend reversal, buy the dip, and sell the rally
New Zealand Dollar / Canadian Dollar NZD/CAD 1-hour chart
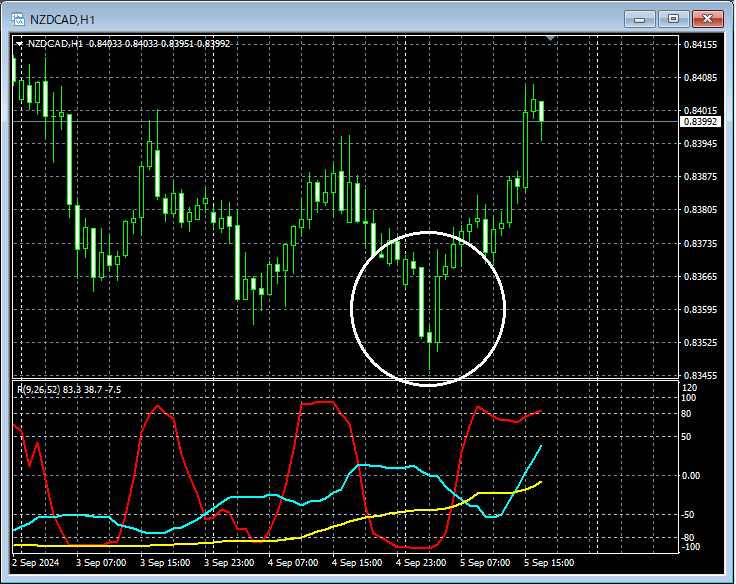
Looking at the area circled in white on the above 1-hour chart,the “Morning Star” of the Sakata Five Methodsappears. This candlestick pattern suggests a bullish reversal, and it might be a scene where you could consider buying the dip on lower timeframes.
New Zealand Dollar / Canadian Dollar NZD/CAD 5-minute chart
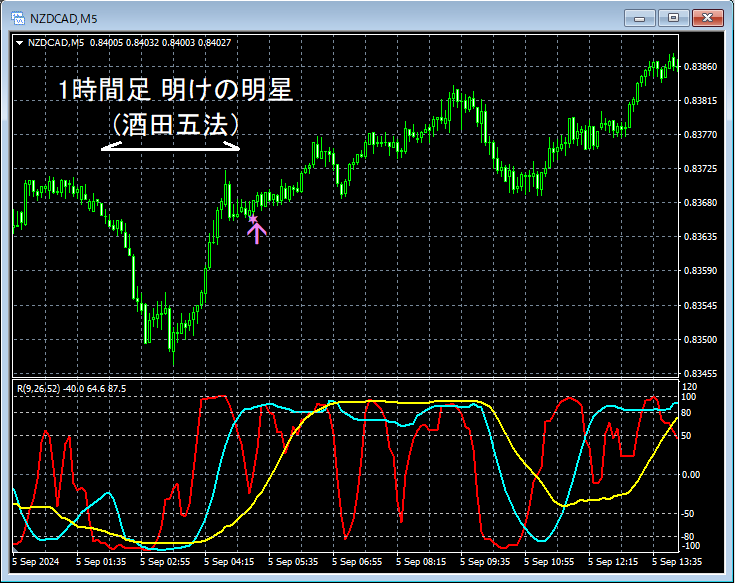
On the higher timeframe of 1 hour, after theSakata Five Methods “Morning Star”appears, on the upper 5-minute chart theR1R2S2 Buy-the-dip signallights up and climbs smoothly.
From this example,a trading method focusing on the Sakata Five Methods “Morning Star”andthe R1R2S2 signalsshowing strong compatibility can be observed.
※Please note that in the charts introduced in this article, for convenience of explanation, circles, straight lines, and squares may have been added.
Indicator that shines when used with RCI【BODSOR・mBDSR】
and method・case studies (PDF) ★GogoJungle AWARD2020 Winner★
https://www.gogojungle.co.jp/tools/indicators/11836
The PDF file is included with 358 documents (over 1,400 pages, over 470,000 characters total).
Most of them are designed to logically link higher and lower timeframes using the RCI 3-line, examining multiple lower-timeframe conditions in sequence, ultimately waiting for dip buys or pullback sells on the lower timeframe (i.e., mBDSR signals).
Additionally,many of them focus on identifying points where multiple entry reasons overlap..
Also included is a method for exploring upside potential and downside potential using the RCI 3-line.
In the PDF explanations,over 1,350 chartsare used.

Indicator that shines when used with RCI: 【BODSOR・mBDSR】
and method・case studies (PDF) ★GogoJungle AWARD2020 Winner★
https://www.gogojungle.co.jp/tools/indicators/11836
R1R2S2 is included in the above product. For details, please see the article below in Investment Navigator+.
RCI 3-line “Two-Stage Confirmation” Indicator “R1R2S2” Release!! Targeting trend reversal, buy the dip, and sell the rally
New Zealand Dollar / Canadian Dollar NZD/CAD 1-hour chart
Looking at the area circled in white on the above 1-hour chart,the “Morning Star” of the Sakata Five Methodsappears. This candlestick pattern suggests a bullish reversal, and it might be a scene where you could consider buying the dip on lower timeframes.
New Zealand Dollar / Canadian Dollar NZD/CAD 5-minute chart
On the higher timeframe of 1 hour, after theSakata Five Methods “Morning Star”appears, on the upper 5-minute chart theR1R2S2 Buy-the-dip signallights up and climbs smoothly.
From this example,a trading method focusing on the Sakata Five Methods “Morning Star”andthe R1R2S2 signalsshowing strong compatibility can be observed.
※Please note that in the charts introduced in this article, for convenience of explanation, circles, straight lines, and squares may have been added.
Indicator that shines when used with RCI【BODSOR・mBDSR】
and method・case studies (PDF) ★GogoJungle AWARD2020 Winner★
https://www.gogojungle.co.jp/tools/indicators/11836
The PDF file is included with 358 documents (over 1,400 pages, over 470,000 characters total).
Most of them are designed to logically link higher and lower timeframes using the RCI 3-line, examining multiple lower-timeframe conditions in sequence, ultimately waiting for dip buys or pullback sells on the lower timeframe (i.e., mBDSR signals).
Additionally,many of them focus on identifying points where multiple entry reasons overlap..
Also included is a method for exploring upside potential and downside potential using the RCI 3-line.
In the PDF explanations,over 1,350 chartsare used.
× ![]()


