

The importance of drilling down from higher timeframes to lower timeframes and the signal of mBDSR (RCI with 2 filters) (11)
【MT5 Version Beta】 has been released!!
mBDSR (Product ID 11836) Purchase Bonus】 MT5 version Indicator (Beta) “mBDSR (No Filter, RCI Filter, MA Filter)”
https://www.gogojungle.co.jp/tools/indicators/56765
【Master RCI!! Trend Reversal, Buy on Dips, Sell on Rallies】
An indicator that shines when used in combination with RCI【BODSOR・mBDSR】
and Method & Case Studies (PDF) ★GogoJungle AWARD2020 Recipient★
https://www.gogojungle.co.jp/tools/indicators/11836
Nikkei Average JP225 5-minute chart
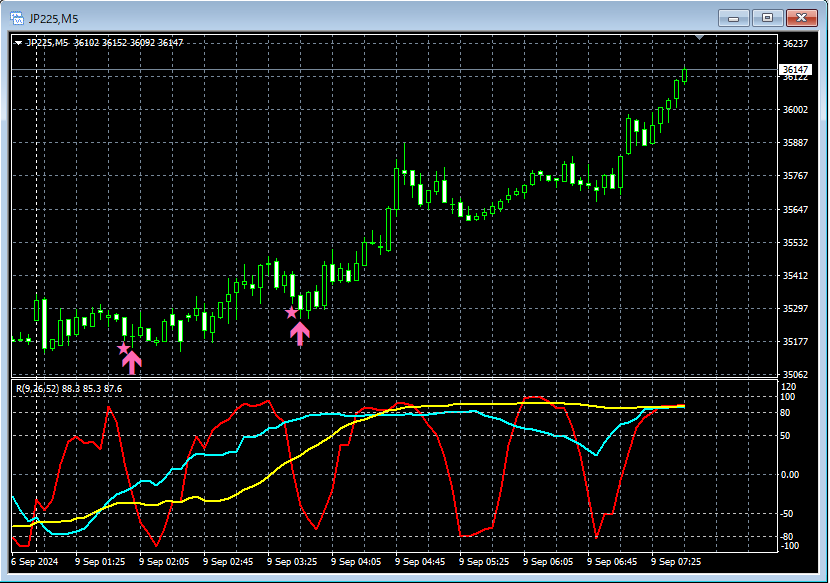
We omit the status of higher timeframes. Also, the detailed explanation of drilling down from higher to lower timeframes using RCI is provided in the included PDF, so it is also omitted here.
In actual trading, when forming a plan,Status of higher timeframesandDrilling down from higher to lower timeframes using RCIare extremely important.
On the 5-minute chart above (the lower timeframe in this example),mBDSR (RCI two-filter) Buy-the-Dip signalis clearly lighting up at the right time.
Also, in this example, placing the stop-loss just below the recent lowallows for good risk-reward trades. (By understanding higher timeframe status and applying RCI-based drilling from higher to lower timeframes,good risk-reward trades become possible.)
*In the charts shown in this article, for clarity, circles, lines, and rectangles may have been added, so please understand this.
An indicator that shines when used in combination with RCI【BODSOR・mBDSR】
and Method & Case Studies (PDF) ★GogoJungle AWARD2020 Recipient★
https://www.gogojungle.co.jp/tools/indicators/11836
The PDF file attachment consists of 358 files (over 1,400 pages, over 470,000 characters).
Most of them are summaries of how to logically link higher and lower timeframes using three RCI lines to examine multiple lower timeframes sequentially, ultimately waiting for dip-buy or pullback sell timing on the lower timeframes (i.e., signals from mBDSR).
Also,many of them focus on identifying points where multiple entry reasons converge.There are also many that include such focus.
Furthermore,the method of exploring upside and downside targets using three RCI lines is included..
In the PDF explanations,over 1,350 chartsare used.

mBDSR (Product ID 11836) Purchase Bonus】 MT5 version Indicator (Beta) “mBDSR (No Filter, RCI Filter, MA Filter)”
https://www.gogojungle.co.jp/tools/indicators/56765
【Master RCI!! Trend Reversal, Buy on Dips, Sell on Rallies】
An indicator that shines when used in combination with RCI【BODSOR・mBDSR】
and Method & Case Studies (PDF) ★GogoJungle AWARD2020 Recipient★
https://www.gogojungle.co.jp/tools/indicators/11836
Nikkei Average JP225 5-minute chart
We omit the status of higher timeframes. Also, the detailed explanation of drilling down from higher to lower timeframes using RCI is provided in the included PDF, so it is also omitted here.
In actual trading, when forming a plan,Status of higher timeframesandDrilling down from higher to lower timeframes using RCIare extremely important.
On the 5-minute chart above (the lower timeframe in this example),mBDSR (RCI two-filter) Buy-the-Dip signalis clearly lighting up at the right time.
Also, in this example, placing the stop-loss just below the recent lowallows for good risk-reward trades. (By understanding higher timeframe status and applying RCI-based drilling from higher to lower timeframes,good risk-reward trades become possible.)
*In the charts shown in this article, for clarity, circles, lines, and rectangles may have been added, so please understand this.
An indicator that shines when used in combination with RCI【BODSOR・mBDSR】
and Method & Case Studies (PDF) ★GogoJungle AWARD2020 Recipient★
https://www.gogojungle.co.jp/tools/indicators/11836
The PDF file attachment consists of 358 files (over 1,400 pages, over 470,000 characters).
Most of them are summaries of how to logically link higher and lower timeframes using three RCI lines to examine multiple lower timeframes sequentially, ultimately waiting for dip-buy or pullback sell timing on the lower timeframes (i.e., signals from mBDSR).
Also,many of them focus on identifying points where multiple entry reasons converge.There are also many that include such focus.
Furthermore,the method of exploring upside and downside targets using three RCI lines is included..
In the PDF explanations,over 1,350 chartsare used.
× ![]()


