

Sign of moving averages we pay attention to, double top, and mBDSR (RCI two-filter)
【MT5 Version Beta】 has been released!!
mBDSR (Product ID 11836) Purchase Bonus】 MT5 Version Indicator (Beta) "mBDSR (No Filter, RCI Filter, MA Filter)"
https://www.gogojungle.co.jp/tools/indicators/56765
An indicator that shines in combination with RCI【BODSOR・mBDSR】
and Method & Case Study (PDF) ★GogoJungle AWARD2020 Winner★
https://www.gogojungle.co.jp/tools/indicators/11836
CAD/JPY 5-minute chart
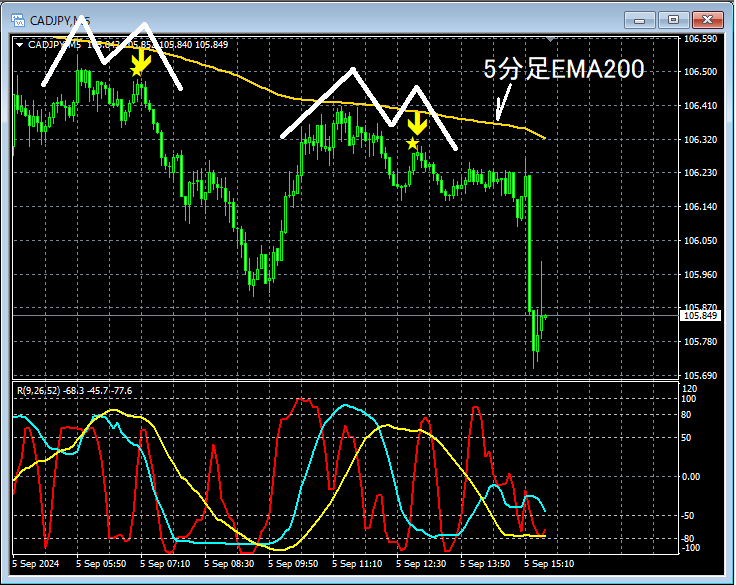
The higher-timeframe situation is omitted. On the 5-minute chart above, the following are focused5-minute EMA200in areas where it has risen toDouble Topand there are two occasions where it drops, but in both casesDouble Topthe timing of the decline starting at the right peakmBDSR (2-filter RCI) overbought/sell signalcaptures this well.
From this example,the trading method focusing on the important moving averages and the double topandthe signal of mBDSRshow a high degree of compatibility.
Additionally, in this example, by placing the stop-loss slightly above the recent high (the left peak of the double top),a high risk-reward tradeis possible.
※ Please note that in the charts described in this article, circles, straight lines, and rectangles may have been added for clarity.
An indicator that shines in combination with RCI【BODSOR・mBDSR】
and Method & Case Study (PDF) ★GogoJungle AWARD2020 Winner★
https://www.gogojungle.co.jp/tools/indicators/11836
The PDF file is attached with 358 files (over 1,400 pages, over 470,000 characters).
Most of them are summaries of cases where the higher/lower timeframes are logically linked using the three RCI lines, examining multiple lower timeframes step by step, and ultimately waiting for pullbacks or retracements on the lower timeframe signals (mBDSR).
Additionally,many focus on capturing points where multiple entry reasons overlap..
Furthermore,there are methods that explore upward and downward targets using the three RCI lines..
In the PDF explanations,over 1,350 chartsare used.

mBDSR (Product ID 11836) Purchase Bonus】 MT5 Version Indicator (Beta) "mBDSR (No Filter, RCI Filter, MA Filter)"
https://www.gogojungle.co.jp/tools/indicators/56765
An indicator that shines in combination with RCI【BODSOR・mBDSR】
and Method & Case Study (PDF) ★GogoJungle AWARD2020 Winner★
https://www.gogojungle.co.jp/tools/indicators/11836
CAD/JPY 5-minute chart
The higher-timeframe situation is omitted. On the 5-minute chart above, the following are focused5-minute EMA200in areas where it has risen toDouble Topand there are two occasions where it drops, but in both casesDouble Topthe timing of the decline starting at the right peakmBDSR (2-filter RCI) overbought/sell signalcaptures this well.
From this example,the trading method focusing on the important moving averages and the double topandthe signal of mBDSRshow a high degree of compatibility.
Additionally, in this example, by placing the stop-loss slightly above the recent high (the left peak of the double top),a high risk-reward tradeis possible.
※ Please note that in the charts described in this article, circles, straight lines, and rectangles may have been added for clarity.
An indicator that shines in combination with RCI【BODSOR・mBDSR】
and Method & Case Study (PDF) ★GogoJungle AWARD2020 Winner★
https://www.gogojungle.co.jp/tools/indicators/11836
The PDF file is attached with 358 files (over 1,400 pages, over 470,000 characters).
Most of them are summaries of cases where the higher/lower timeframes are logically linked using the three RCI lines, examining multiple lower timeframes step by step, and ultimately waiting for pullbacks or retracements on the lower timeframe signals (mBDSR).
Additionally,many focus on capturing points where multiple entry reasons overlap..
Furthermore,there are methods that explore upward and downward targets using the three RCI lines..
In the PDF explanations,over 1,350 chartsare used.
× ![]()


