

Consecutive pin bars on the higher timeframe and R1R2S2 pullback buy signal
【MT5 Version Beta】 has been released!!
mBDSR (Product ID 11836) Purchase Bonus】MT5 Indicator (Beta) “mBDSR (No filter, RCI filter, MA filter)”
https://www.gogojungle.co.jp/tools/indicators/56765
【Master RCI!! Trend reversal, Buy on dip, Sell on rally】
An indicator that shines when combined with RCI【BODSOR・mBDSR】
and methods・case studies (PDF) ★GogoJungle AWARD2020 winner★
https://www.gogojungle.co.jp/tools/indicators/11836
R1R2S2 is included in the above products. For details, please see the Investment Navigator+ article below.
Indicator “R1R2S2” that targets trend reversal, buy on dip, and sell on rally with 2-step confirmation using 3 RCI lines released!!
Gold XAUUSD Daily
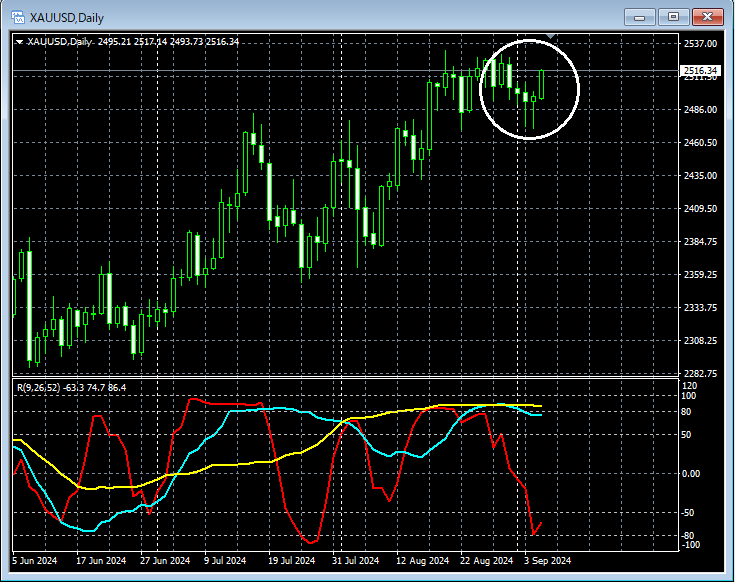
Looking at the upper daily chart, the area circled in white suggests a risePin bar (candlestick with a long lower wick)appears two in a row. It might not be strange to consider buying on dips in lower timeframes.
Gold XAUUSD 1-hour chart
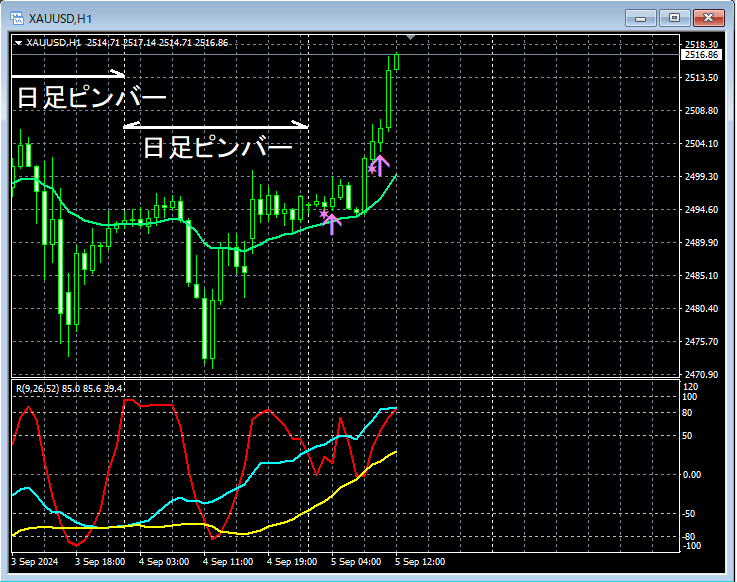
From the 1-hour chart above, it suggests an uptrend on the daily chartPin bar (long lower wick)appears twice in a row and then moves higher steadily. During this rise,buy signal of R1R2S2lights up twice.
From this example,the trading method focusing on pin barsandthe signals of R1R2S2show a strong compatibility.
※ Please note that in the charts introduced in this article, for convenience of explanation, circles, lines, and rectangles may be drawn.
An indicator that shines when combined with RCI【BODSOR・mBDSR】
and methods・case studies (PDF) ★GogoJungle AWARD2020 winner★
https://www.gogojungle.co.jp/tools/indicators/11836
The PDF file includes 358 items (over 1,400 pages, over 470,000 characters).
Many of these areexamples that use three RCI lines to logically link higher and lower timeframes, sequentially considering multiple lower-timeframe conditions, and finally waiting for lower-timeframe pullbacks or pullbacks timing (i.e., mBDSR signals)..
Additionally,many emphasize capturing points where multiple entry reasons overlap..
Also included is a method to explore upside and downside targets using three RCI lines.
In the PDF explanations,over 1,350 chartsare used.

mBDSR (Product ID 11836) Purchase Bonus】MT5 Indicator (Beta) “mBDSR (No filter, RCI filter, MA filter)”
https://www.gogojungle.co.jp/tools/indicators/56765
【Master RCI!! Trend reversal, Buy on dip, Sell on rally】
An indicator that shines when combined with RCI【BODSOR・mBDSR】
and methods・case studies (PDF) ★GogoJungle AWARD2020 winner★
https://www.gogojungle.co.jp/tools/indicators/11836
R1R2S2 is included in the above products. For details, please see the Investment Navigator+ article below.
Indicator “R1R2S2” that targets trend reversal, buy on dip, and sell on rally with 2-step confirmation using 3 RCI lines released!!
Gold XAUUSD Daily
Looking at the upper daily chart, the area circled in white suggests a risePin bar (candlestick with a long lower wick)appears two in a row. It might not be strange to consider buying on dips in lower timeframes.
Gold XAUUSD 1-hour chart
From the 1-hour chart above, it suggests an uptrend on the daily chartPin bar (long lower wick)appears twice in a row and then moves higher steadily. During this rise,buy signal of R1R2S2lights up twice.
From this example,the trading method focusing on pin barsandthe signals of R1R2S2show a strong compatibility.
※ Please note that in the charts introduced in this article, for convenience of explanation, circles, lines, and rectangles may be drawn.
An indicator that shines when combined with RCI【BODSOR・mBDSR】
and methods・case studies (PDF) ★GogoJungle AWARD2020 winner★
https://www.gogojungle.co.jp/tools/indicators/11836
The PDF file includes 358 items (over 1,400 pages, over 470,000 characters).
Many of these areexamples that use three RCI lines to logically link higher and lower timeframes, sequentially considering multiple lower-timeframe conditions, and finally waiting for lower-timeframe pullbacks or pullbacks timing (i.e., mBDSR signals)..
Additionally,many emphasize capturing points where multiple entry reasons overlap..
Also included is a method to explore upside and downside targets using three RCI lines.
In the PDF explanations,over 1,350 chartsare used.
× ![]()


