

Important moving averages, double top, and R1R2S2 pullback sell signals
【MT5 Version Beta】 has been released!!
mBDSR (Product ID 11836) Purchase Bonus】 MT5 Indicator (Beta) “mBDSR (no filter, RCI filter, MA filter)”
https://www.gogojungle.co.jp/tools/indicators/56765
【Master RCI!! Trend reversal, on-dip buying, pullback selling】
An indicator that shines when used in combination with RCI【BODSOR・mBDSR】
Methods & Case Studies (PDF) ★GogoJungle AWARD2020 Winner★
https://www.gogojungle.co.jp/tools/indicators/11836
R1R2S2 is included in the above products. For details, please see the following Investor Guide+ article.
RCI 3-line “Two-Stage Confirmation” Indicator for Trend Reversal, On-Dip Buying, and Pullback Selling: R1R2S2 Released!!
Nikkei Average JP225 5-minute chart
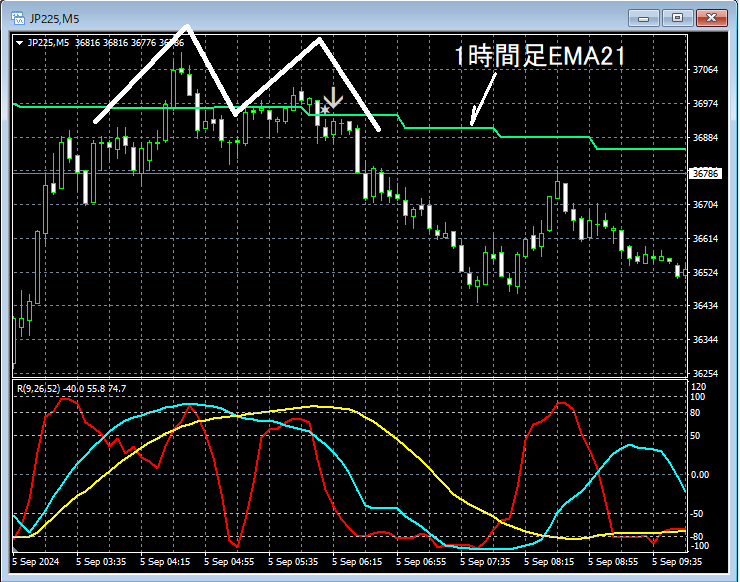
The higher-timeframe context is omitted.
In the 5-minute chart above, the important areanear the 1-hour EMA21is forming adouble topand moving lower. At the right shoulder of thatdouble topthere isan R1R2S2 sell signallit up.
From this example,a trading method focusing on moving averages and double topsandthe signals of R1R2S2show strong compatibility.
※Please note that for convenience, the chart in this article may include circles, lines, and boxes.
An indicator that shines when used in combination with RCI【BODSOR・mBDSR】
Methods & Case Studies (PDF) ★GogoJungle AWARD2020 Winner★
https://www.gogojungle.co.jp/tools/indicators/11836
The PDF file contains 358 items (over 1,400 pages, over 470,000 characters).
Most of them are summaries of how to logically link higher and lower timeframes using the 3-line RCI, examining multiple lower timeframes step by step, and ultimately waiting for pullbacks or buy signals (mBDSR) on the lower timeframe.
Additionally,many entries emphasize converging multiple entry signalsas a focus.
Furthermore,there are also methods for exploring upside and downside targets using the three-line RCI..
In the PDF explanations,more than 1,350 chartsare used.

mBDSR (Product ID 11836) Purchase Bonus】 MT5 Indicator (Beta) “mBDSR (no filter, RCI filter, MA filter)”
https://www.gogojungle.co.jp/tools/indicators/56765
【Master RCI!! Trend reversal, on-dip buying, pullback selling】
An indicator that shines when used in combination with RCI【BODSOR・mBDSR】
Methods & Case Studies (PDF) ★GogoJungle AWARD2020 Winner★
https://www.gogojungle.co.jp/tools/indicators/11836
R1R2S2 is included in the above products. For details, please see the following Investor Guide+ article.
RCI 3-line “Two-Stage Confirmation” Indicator for Trend Reversal, On-Dip Buying, and Pullback Selling: R1R2S2 Released!!
Nikkei Average JP225 5-minute chart
The higher-timeframe context is omitted.
In the 5-minute chart above, the important areanear the 1-hour EMA21is forming adouble topand moving lower. At the right shoulder of thatdouble topthere isan R1R2S2 sell signallit up.
From this example,a trading method focusing on moving averages and double topsandthe signals of R1R2S2show strong compatibility.
※Please note that for convenience, the chart in this article may include circles, lines, and boxes.
An indicator that shines when used in combination with RCI【BODSOR・mBDSR】
Methods & Case Studies (PDF) ★GogoJungle AWARD2020 Winner★
https://www.gogojungle.co.jp/tools/indicators/11836
The PDF file contains 358 items (over 1,400 pages, over 470,000 characters).
Most of them are summaries of how to logically link higher and lower timeframes using the 3-line RCI, examining multiple lower timeframes step by step, and ultimately waiting for pullbacks or buy signals (mBDSR) on the lower timeframe.
Additionally,many entries emphasize converging multiple entry signalsas a focus.
Furthermore,there are also methods for exploring upside and downside targets using the three-line RCI..
In the PDF explanations,more than 1,350 chartsare used.
× ![]()


