

Important moving average line, breakout high, and mBDSR (RCI with 2 filters) pullback-buy signal
【MT5 Version Beta】 has been released!!
mBDSR (Product ID 11836) Purchase Bonus】 MT5 Version Indicator (Beta) "mBDSR (No filter, RCI filter, MA filter)"
https://www.gogojungle.co.jp/tools/indicators/56765
【Master RCI!! Trend reversal, pullback buying, retracement selling】
Indicator that shines when combined with RCI【BODSOR・mBDSR】
Methods & Case Studies (PDF) ★GogoJungle AWARD2020 Winner★
https://www.gogojungle.co.jp/tools/indicators/11836
EURUSD — EuroDollar — 30-minute chart
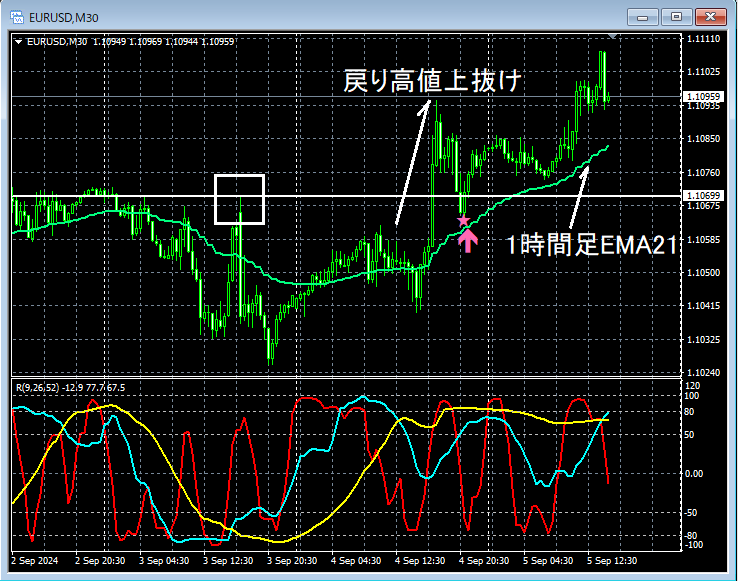
Higher-timeframe conditions are omitted.
Pullback highAfter breaking above, the1-hour EMA21gets close to a downturn,mBDSR (2-filter with RCI) pullback buy signallights up, and price is rising steadily.
From this example,a trading method focusing on pullback highs (Dow Theory) and moving averagesandthe harmony with mBDSR signalscan be seen.
※Please note that in charts referenced in this article, for convenience of explanation, some circles, lines, and rectangles may have been added.
Indicator that shines when combined with RCI【BODSOR・mBDSR】
Methods & Case Studies (PDF) ★GogoJungle AWARD2020 Winner★
https://www.gogojungle.co.jp/tools/indicators/11836
The PDF file includes 358 files (over 1,400 pages, over 470,000 characters).
Most of them arecase studies detailing how to logically link higher and lower timeframes using the RCI 3-line setup, and ultimately waiting for pullback buying or retracement selling signals on the lower timeframes (i.e., mBDSR signals)..
Additionally,many focus on identifying points where multiple entry reasons overlap..
Furthermore,there are methods that explore upward and downward targets using the RCI 3-line setup..
In the PDF explanations,over 1,350 chartsare used.

mBDSR (Product ID 11836) Purchase Bonus】 MT5 Version Indicator (Beta) "mBDSR (No filter, RCI filter, MA filter)"
https://www.gogojungle.co.jp/tools/indicators/56765
【Master RCI!! Trend reversal, pullback buying, retracement selling】
Indicator that shines when combined with RCI【BODSOR・mBDSR】
Methods & Case Studies (PDF) ★GogoJungle AWARD2020 Winner★
https://www.gogojungle.co.jp/tools/indicators/11836
EURUSD — EuroDollar — 30-minute chart
Higher-timeframe conditions are omitted.
Pullback highAfter breaking above, the1-hour EMA21gets close to a downturn,mBDSR (2-filter with RCI) pullback buy signallights up, and price is rising steadily.
From this example,a trading method focusing on pullback highs (Dow Theory) and moving averagesandthe harmony with mBDSR signalscan be seen.
※Please note that in charts referenced in this article, for convenience of explanation, some circles, lines, and rectangles may have been added.
Indicator that shines when combined with RCI【BODSOR・mBDSR】
Methods & Case Studies (PDF) ★GogoJungle AWARD2020 Winner★
https://www.gogojungle.co.jp/tools/indicators/11836
The PDF file includes 358 files (over 1,400 pages, over 470,000 characters).
Most of them arecase studies detailing how to logically link higher and lower timeframes using the RCI 3-line setup, and ultimately waiting for pullback buying or retracement selling signals on the lower timeframes (i.e., mBDSR signals)..
Additionally,many focus on identifying points where multiple entry reasons overlap..
Furthermore,there are methods that explore upward and downward targets using the RCI 3-line setup..
In the PDF explanations,over 1,350 chartsare used.
× ![]()


