

Counter trend line, Head and Shoulders, and mBDSR (RCI two-filter) bearish return signal
【MT5 Beta Version】 has been released!!
mBDSR (Product ID 11836) Purchase Bonus】 MT5 Indicator (Beta) “mBDSR (no filter, RCI filter, MA filter)”
https://www.gogojungle.co.jp/tools/indicators/56765
【Master RCI!! Trend reversal, buying on pullbacks, selling on retracements】
An indicator that shines when combined with RCI【BODSOR・mBDSR】
and methods & case studies (PDF) ★GogoJungle AWARD2020 winner★
https://www.gogojungle.co.jp/tools/indicators/11836
EURJPY 5-minute chart
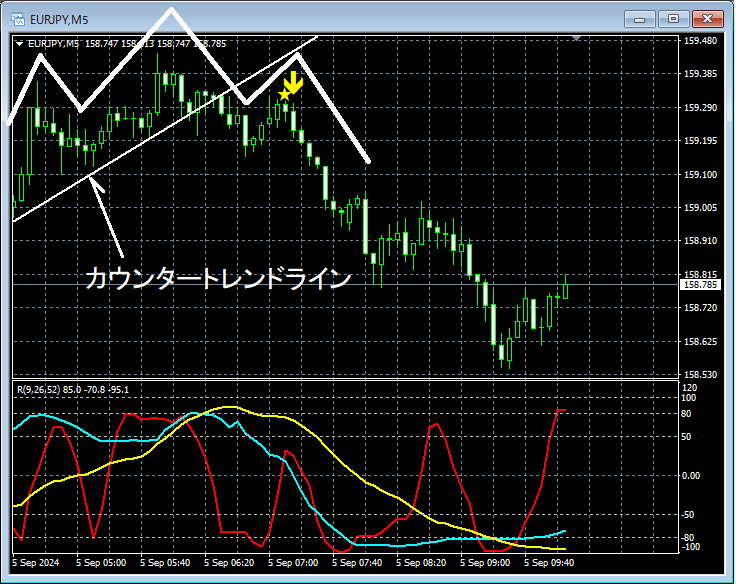
The higher timeframe chart is omitted, but it is not unusual to target selling on retracements. On the lower timeframe—the 5-minute chart above—Counter-trend lineafter a break below, with an upward movemBDSR (RCI two-filter) pullback sell signallights up. In this case, this signalcorresponds to the timing of the start of the decline at the right shoulder of the head-and-shoulders patternfectively capturing the timing of the move.
From this example,a trading method focusing on counter-trend lines and head-and-shoulders patternsandthe signals of mBDSRshow a strong synergy.
※ Please note that the charts introduced in this article may have had circles, lines, or boxes added for explanatory convenience.
An indicator that shines when combined with RCI【BODSOR・mBDSR】
and methods & case studies (PDF) ★GogoJungle AWARD2020 winner★
https://www.gogojungle.co.jp/tools/indicators/11836
The PDF file includes 358 items (over 1,400 pages, over 470,000 characters).
Many of them areexamples that logically link higher and lower timeframes using three RCI lines, sequentially analyzing multiple lower-timeframe situations, and ultimately integrating the timing of pullbacks or pullbacks (i.e., mBDSR signals) on the lower timeframe..
Also,many focus on identifying points where multiple entry reasons coincide..
Additionally,there are methods that explore upside and downside targets using three RCI lines..
In the PDF explanations,more than 1,350 chartsare used.

mBDSR (Product ID 11836) Purchase Bonus】 MT5 Indicator (Beta) “mBDSR (no filter, RCI filter, MA filter)”
https://www.gogojungle.co.jp/tools/indicators/56765
【Master RCI!! Trend reversal, buying on pullbacks, selling on retracements】
An indicator that shines when combined with RCI【BODSOR・mBDSR】
and methods & case studies (PDF) ★GogoJungle AWARD2020 winner★
https://www.gogojungle.co.jp/tools/indicators/11836
EURJPY 5-minute chart
The higher timeframe chart is omitted, but it is not unusual to target selling on retracements. On the lower timeframe—the 5-minute chart above—Counter-trend lineafter a break below, with an upward movemBDSR (RCI two-filter) pullback sell signallights up. In this case, this signalcorresponds to the timing of the start of the decline at the right shoulder of the head-and-shoulders patternfectively capturing the timing of the move.
From this example,a trading method focusing on counter-trend lines and head-and-shoulders patternsandthe signals of mBDSRshow a strong synergy.
※ Please note that the charts introduced in this article may have had circles, lines, or boxes added for explanatory convenience.
An indicator that shines when combined with RCI【BODSOR・mBDSR】
and methods & case studies (PDF) ★GogoJungle AWARD2020 winner★
https://www.gogojungle.co.jp/tools/indicators/11836
The PDF file includes 358 items (over 1,400 pages, over 470,000 characters).
Many of them areexamples that logically link higher and lower timeframes using three RCI lines, sequentially analyzing multiple lower-timeframe situations, and ultimately integrating the timing of pullbacks or pullbacks (i.e., mBDSR signals) on the lower timeframe..
Also,many focus on identifying points where multiple entry reasons coincide..
Additionally,there are methods that explore upside and downside targets using three RCI lines..
In the PDF explanations,more than 1,350 chartsare used.
× ![]()


