

[Basic Pattern] Double Top and mBDSR (RCI 2-band filter) Rebound Sell Signal
【MT5 Version Beta】 has been released!!
mBDSR (Product ID 11836) Purchase Bonus】 MT5 Version Indicator (Beta) “mBDSR (No filters, RCI filters, MA filters)”
https://www.gogojungle.co.jp/tools/indicators/56765
【Master RCI!! Trend reversal, pullbacks, and selling on bounces】
An indicator that shines when combined with RCI【BODSOR・mBDSR】
and methods/case studies (PDF) ★GogoJungle AWARD2020 Winner★
https://www.gogojungle.co.jp/tools/indicators/11836
USD/JPY 5-minute chart
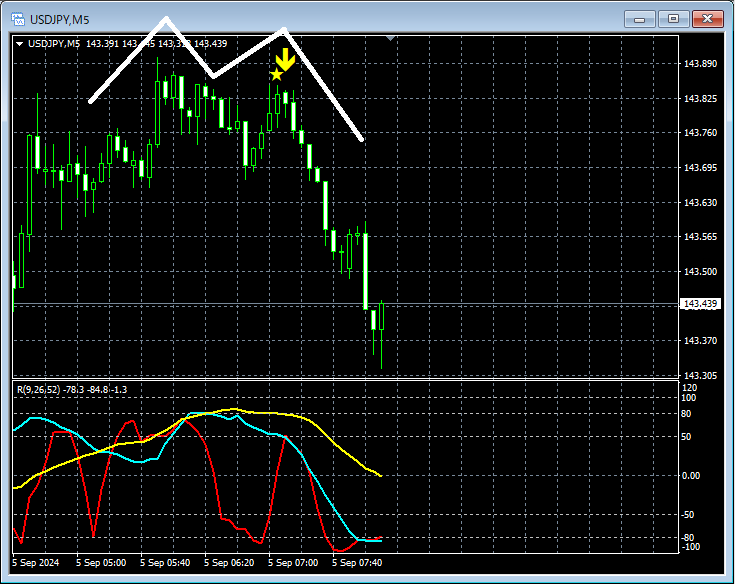
On the above 5-minute chart,the timing of the start of the decline on the right peak of the double topis well captured by themBDSR (RCI two-filter) overbought signal.
From this example,the trade method focusing on the double topandthe signals of mBDSRshow a high degree of compatibility.
Also, in this example, by placing the stop loss slightly above the most recent high (the left peak of the double top)the trade can have a high risk-reward ratio.
※ Please note that in the charts introduced in this article, for convenience of explanation, circles, lines, and boxes may be drawn.
An indicator that shines when combined with RCI【BODSOR・mBDSR】
and methods/case studies (PDF) ★GogoJungle AWARD2020 Winner★
https://www.gogojungle.co.jp/tools/indicators/11836
The PDF file contains 358 items (over 1,400 pages, over 470,000 characters).
Many of them are summaries of cases where multiple entry reasons align, using three-line RCI to logically link higher and lower timeframes and gradually examine the conditions of multiple lower timeframes, ultimately waiting for pullbacks or buying on dips on the lower timeframe (i.e., the signals of mBDSR).
In addition,many focus on capturing points where multiple entry reasons overlap..
Also,there are methods that explore up and down targets using three-line RCI..
In the PDF explanations,over 1,350 chartsare used.

mBDSR (Product ID 11836) Purchase Bonus】 MT5 Version Indicator (Beta) “mBDSR (No filters, RCI filters, MA filters)”
https://www.gogojungle.co.jp/tools/indicators/56765
【Master RCI!! Trend reversal, pullbacks, and selling on bounces】
An indicator that shines when combined with RCI【BODSOR・mBDSR】
and methods/case studies (PDF) ★GogoJungle AWARD2020 Winner★
https://www.gogojungle.co.jp/tools/indicators/11836
USD/JPY 5-minute chart
On the above 5-minute chart,the timing of the start of the decline on the right peak of the double topis well captured by themBDSR (RCI two-filter) overbought signal.
From this example,the trade method focusing on the double topandthe signals of mBDSRshow a high degree of compatibility.
Also, in this example, by placing the stop loss slightly above the most recent high (the left peak of the double top)the trade can have a high risk-reward ratio.
※ Please note that in the charts introduced in this article, for convenience of explanation, circles, lines, and boxes may be drawn.
An indicator that shines when combined with RCI【BODSOR・mBDSR】
and methods/case studies (PDF) ★GogoJungle AWARD2020 Winner★
https://www.gogojungle.co.jp/tools/indicators/11836
The PDF file contains 358 items (over 1,400 pages, over 470,000 characters).
Many of them are summaries of cases where multiple entry reasons align, using three-line RCI to logically link higher and lower timeframes and gradually examine the conditions of multiple lower timeframes, ultimately waiting for pullbacks or buying on dips on the lower timeframe (i.e., the signals of mBDSR).
In addition,many focus on capturing points where multiple entry reasons overlap..
Also,there are methods that explore up and down targets using three-line RCI..
In the PDF explanations,over 1,350 chartsare used.
× ![]()


