

[mBDSR (RCI2 Single Band Filter) Practical Example] Look for signs of reversal around a moving average that is being given importance (3)
【MT5 Version Beta】 has been released!!
mBDSR (Product ID 11836) Purchase Bonus】 MT5 Indicator (Beta) “mBDSR (No Filter, RCI Filter, MA Filter)”
https://www.gogojungle.co.jp/tools/indicators/56765
【Master RCI!! Trend Reversal, Buy the Dip, Sell on Rallies】
An indicator that shines when used in combination with RCI【BODSOR・mBDSR】
and its methods and case studies (PDF) ★GogoJungle AWARD2020 Winner★
https://www.gogojungle.co.jp/tools/indicators/11836
NZDJPY NZDJPY Five-Minute Chart
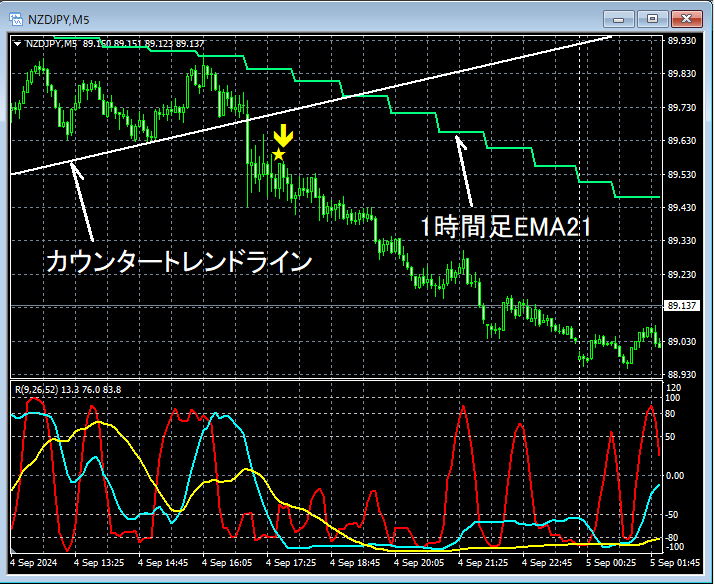
The higher-timeframe outlook is omitted.Important: 1-hour EMA21Has risen close to the vicinity, so it may not be unusual to look for a fade (sell after a rise). We focus on looking for signs of reversal near the moving average that we consider important (in this case1-hour EMA21).
If we look at the five-minute chart above1-hour EMA21reverses from the vicinity. AndCounter-Trend Linerises after a break below,mBDSR (RCI two-filter) sell signallights up and the price drops sharply.
From this example,a trading method focusing on reversals at moving averages and counter-trend lines shows compatibility withthe signals frommBDSR.
Note: In this article, charts may have been annotated with circles, lines, or boxes for ease of explanation, please understand.
An indicator that shines when combined with RCI【BODSOR・mBDSR】
and its methods and case studies (PDF) ★GogoJungle AWARD2020 Winner★
https://www.gogojungle.co.jp/tools/indicators/11836
The PDF file includes 358 files (over 1,400 pages, over 470,000 characters).
Most of them are compiled into a framework where the upper and lower timeframes are logically linked using three RCI lines, sequentially examining the status of multiple lower timeframes, and ultimately waiting for a dip buy or a pullback sell timing (i.e., mBDSR signal) on the lower timeframe.
Also,many entries focus on identifying points where multiple entry reasons overlap..
Additionally,there is also a method that uses the three-RCI-line approach to explore upside and downside targets..
In the PDF explanations,more than 1,350 chartsare used.

mBDSR (Product ID 11836) Purchase Bonus】 MT5 Indicator (Beta) “mBDSR (No Filter, RCI Filter, MA Filter)”
https://www.gogojungle.co.jp/tools/indicators/56765
【Master RCI!! Trend Reversal, Buy the Dip, Sell on Rallies】
An indicator that shines when used in combination with RCI【BODSOR・mBDSR】
and its methods and case studies (PDF) ★GogoJungle AWARD2020 Winner★
https://www.gogojungle.co.jp/tools/indicators/11836
NZDJPY NZDJPY Five-Minute Chart
The higher-timeframe outlook is omitted.Important: 1-hour EMA21Has risen close to the vicinity, so it may not be unusual to look for a fade (sell after a rise). We focus on looking for signs of reversal near the moving average that we consider important (in this case1-hour EMA21).
If we look at the five-minute chart above1-hour EMA21reverses from the vicinity. AndCounter-Trend Linerises after a break below,mBDSR (RCI two-filter) sell signallights up and the price drops sharply.
From this example,a trading method focusing on reversals at moving averages and counter-trend lines shows compatibility withthe signals frommBDSR.
Note: In this article, charts may have been annotated with circles, lines, or boxes for ease of explanation, please understand.
An indicator that shines when combined with RCI【BODSOR・mBDSR】
and its methods and case studies (PDF) ★GogoJungle AWARD2020 Winner★
https://www.gogojungle.co.jp/tools/indicators/11836
The PDF file includes 358 files (over 1,400 pages, over 470,000 characters).
Most of them are compiled into a framework where the upper and lower timeframes are logically linked using three RCI lines, sequentially examining the status of multiple lower timeframes, and ultimately waiting for a dip buy or a pullback sell timing (i.e., mBDSR signal) on the lower timeframe.
Also,many entries focus on identifying points where multiple entry reasons overlap..
Additionally,there is also a method that uses the three-RCI-line approach to explore upside and downside targets..
In the PDF explanations,more than 1,350 chartsare used.
× ![]()


