

[mBDSR (RCI2 real-time filter) usage example] Look for signs of rebound near the moving average line that is considered important
【MT5 Version Beta】 has been released!!
mBDSR (Product ID 11836) Purchase Bonus】 MT5 Version Indicator (Beta) "mBDSR (no filter, RCI filter, MA filter)"
https://www.gogojungle.co.jp/tools/indicators/56765
【Master RCI!! Trend Reversal, Buy on Dips, Sell on Rallies】
An indicator that shines when combined with RCI【BODSOR・mBDSR】
and method/case studies (PDF) ★GogoJungle AWARD2020 winner★
https://www.gogojungle.co.jp/tools/indicators/11836
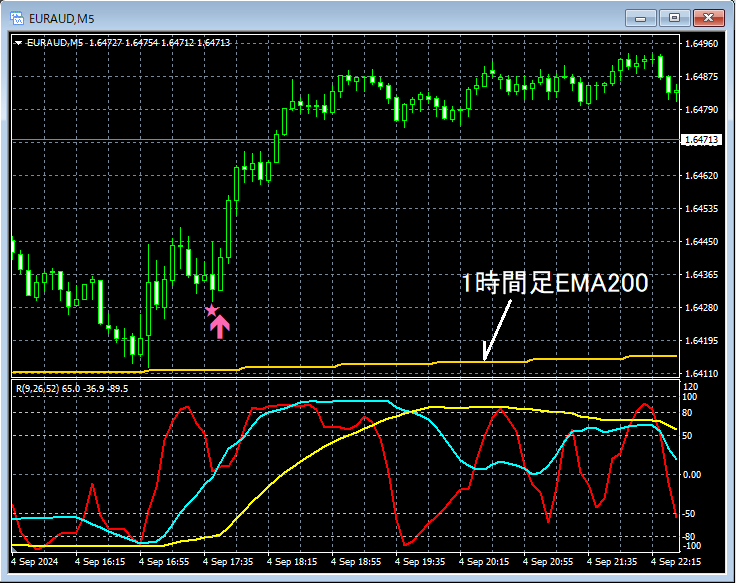
EUR/AUD 5-minute chart
Details about the higher time frame are omitted. Also,Overview of the top-to-bottom application using RCIis explained in detail in the included PDF, so it is omitted here as well.
In actual trading, when formulating a plan, it is extremely important tounderstand the higher time frameandapply the upper-to-lower time frame breakdown using RCIas described in the PDF.
Looking at the 5-minute chart above,Price is rebounding near the 1-hour EMA200. Afterwards,the dip-buy signal of mBDSR (RCI two-filter) activates and price rises sharply.
From this example,a trading method focused on rebounds at moving averagesandthe compatibility with mBDSR signalsare evident.
※Please note that, for convenience, some charts in this article have added circles, lines, and boxes.
An indicator that shines when combined with RCI【BODSOR・mBDSR】
and method/case studies (PDF) ★GogoJungle AWARD2020 winner★
https://www.gogojungle.co.jp/tools/indicators/11836
The PDF file includes 358 files (over 1,400 pages, over 470,000 characters in total).
Many of these areexamples that logically link higher and lower time frames using three RCI lines to examine multiple lower time frames sequentially, ultimately waiting for pullbacks or rallies on the lower time frame (i.e., mBDSR signals)..
Additionally,many focus on identifying points where multiple entry signals overlap..
Furthermore,the method to assess the upside and downside using three RCI linesis included.
In the PDF explanations,over 1,350 chartsare used.

mBDSR (Product ID 11836) Purchase Bonus】 MT5 Version Indicator (Beta) "mBDSR (no filter, RCI filter, MA filter)"
https://www.gogojungle.co.jp/tools/indicators/56765
【Master RCI!! Trend Reversal, Buy on Dips, Sell on Rallies】
An indicator that shines when combined with RCI【BODSOR・mBDSR】
and method/case studies (PDF) ★GogoJungle AWARD2020 winner★
https://www.gogojungle.co.jp/tools/indicators/11836
EUR/AUD 5-minute chart
Details about the higher time frame are omitted. Also,Overview of the top-to-bottom application using RCIis explained in detail in the included PDF, so it is omitted here as well.
In actual trading, when formulating a plan, it is extremely important tounderstand the higher time frameandapply the upper-to-lower time frame breakdown using RCIas described in the PDF.
Looking at the 5-minute chart above,Price is rebounding near the 1-hour EMA200. Afterwards,the dip-buy signal of mBDSR (RCI two-filter) activates and price rises sharply.
From this example,a trading method focused on rebounds at moving averagesandthe compatibility with mBDSR signalsare evident.
※Please note that, for convenience, some charts in this article have added circles, lines, and boxes.
An indicator that shines when combined with RCI【BODSOR・mBDSR】
and method/case studies (PDF) ★GogoJungle AWARD2020 winner★
https://www.gogojungle.co.jp/tools/indicators/11836
The PDF file includes 358 files (over 1,400 pages, over 470,000 characters in total).
Many of these areexamples that logically link higher and lower time frames using three RCI lines to examine multiple lower time frames sequentially, ultimately waiting for pullbacks or rallies on the lower time frame (i.e., mBDSR signals)..
Additionally,many focus on identifying points where multiple entry signals overlap..
Furthermore,the method to assess the upside and downside using three RCI linesis included.
In the PDF explanations,over 1,350 chartsare used.
× ![]()


