

[mBDSR (RCI2 main filter) usage example] Looking for signs of a rebound near the moving average line that is considered important (2)
【MT5 Version Beta】 has been released!!
mBDSR (Product ID 11836) Purchase Bonus】MT5 Version Indicator (Beta) “mBDSR (no filter, RCI filter, MA filter)”
https://www.gogojungle.co.jp/tools/indicators/56765
【Master RCI!! Trend reversal, pullback buying, pullback selling】
A powerful indicator when combined with RCI【BODSOR・mBDSR】
and methods & case studies (PDF) ★GogoJungle AWARD2020 winner★
https://www.gogojungle.co.jp/tools/indicators/11836
GBP/JPY 1-hour chart
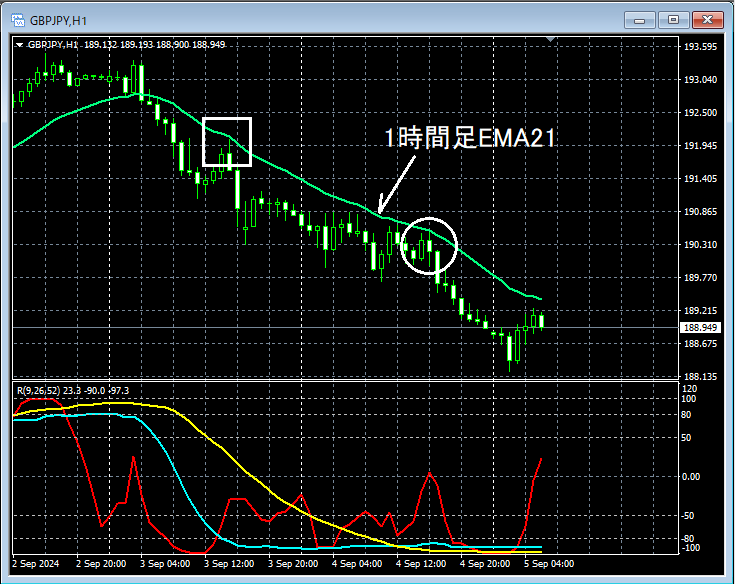
Looking at the area circled in white on the 1-hour chart above, it previously acted as resistance1-hour EMA21has risen close to the vicinity, so it might not be weird to look for short entries on a pullback. The moving average being emphasized (in this case1-hour EMA21) warrants checking for signs of reversal on lower timeframes near that area.
GBP/JPY 5-minute chart
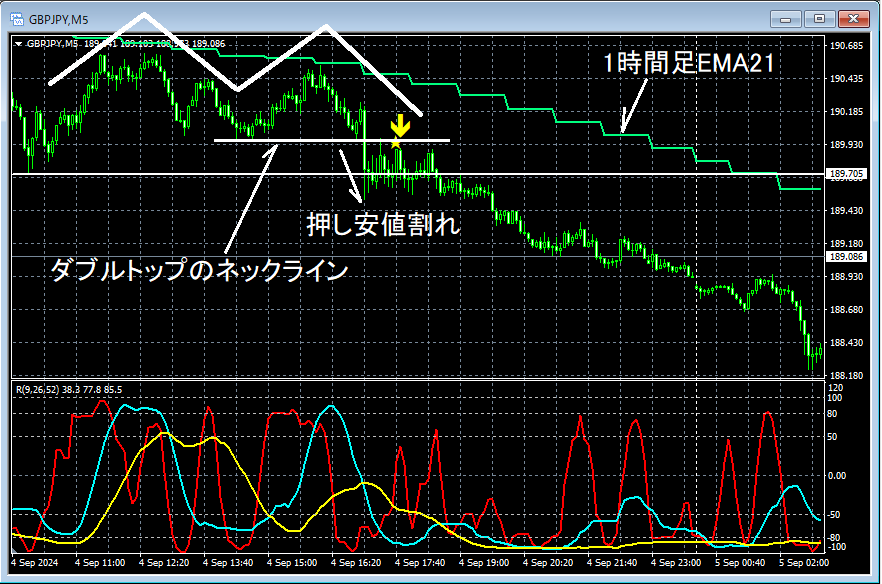
Looking at the above 5-minute chart1-hour EMA21nearbyDouble topformed and reversed. Thenbreak of the minor swing low,nearly reached the neckline of the double top,an alert for a pullback sell from mBDSR (RCI two-filter) has lit up and the price has dropped significantly.
From this example,there is a high compatibility between trading methods that focus on reversals around moving averages, double tops, and pullback lows (Dow Theory) andthe signals from mBDSR.
※ Please note that for convenience, charts in this article may have had circles, straight lines, squares, etc. drawn on them.
A powerful indicator when combined with RCI【BODSOR・mBDSR】
and methods & case studies (PDF) ★GogoJungle AWARD2020 winner★
https://www.gogojungle.co.jp/tools/indicators/11836
The PDF file is included with 358 files (over 1,400 pages, over 470,000 characters in total).
Many of thesedocument how to logically link higher and lower timeframes using three RCI lines, examining multiple lower timeframes sequentially, and ultimately waiting for pullback buying or pullback selling timing on the lower timeframe (i.e., signals from mBDSR)in detail.
Additionally,many focus on identifying points where multiple entry reasons coincide..
Furthermore,there are methods that explore upside and downside targets using three RCI lines..
In the PDF explanations,more than 1,350 chartsare used.

mBDSR (Product ID 11836) Purchase Bonus】MT5 Version Indicator (Beta) “mBDSR (no filter, RCI filter, MA filter)”
https://www.gogojungle.co.jp/tools/indicators/56765
【Master RCI!! Trend reversal, pullback buying, pullback selling】
A powerful indicator when combined with RCI【BODSOR・mBDSR】
and methods & case studies (PDF) ★GogoJungle AWARD2020 winner★
https://www.gogojungle.co.jp/tools/indicators/11836
GBP/JPY 1-hour chart
Looking at the area circled in white on the 1-hour chart above, it previously acted as resistance1-hour EMA21has risen close to the vicinity, so it might not be weird to look for short entries on a pullback. The moving average being emphasized (in this case1-hour EMA21) warrants checking for signs of reversal on lower timeframes near that area.
GBP/JPY 5-minute chart
Looking at the above 5-minute chart1-hour EMA21nearbyDouble topformed and reversed. Thenbreak of the minor swing low,nearly reached the neckline of the double top,an alert for a pullback sell from mBDSR (RCI two-filter) has lit up and the price has dropped significantly.
From this example,there is a high compatibility between trading methods that focus on reversals around moving averages, double tops, and pullback lows (Dow Theory) andthe signals from mBDSR.
※ Please note that for convenience, charts in this article may have had circles, straight lines, squares, etc. drawn on them.
A powerful indicator when combined with RCI【BODSOR・mBDSR】
and methods & case studies (PDF) ★GogoJungle AWARD2020 winner★
https://www.gogojungle.co.jp/tools/indicators/11836
The PDF file is included with 358 files (over 1,400 pages, over 470,000 characters in total).
Many of thesedocument how to logically link higher and lower timeframes using three RCI lines, examining multiple lower timeframes sequentially, and ultimately waiting for pullback buying or pullback selling timing on the lower timeframe (i.e., signals from mBDSR)in detail.
Additionally,many focus on identifying points where multiple entry reasons coincide..
Furthermore,there are methods that explore upside and downside targets using three RCI lines..
In the PDF explanations,more than 1,350 chartsare used.
× ![]()


