

[Example of using mBDSR (RCI2 two-filter)] Look for signs of a rebound near the moving average line that is prioritized (1)
【MT5 Version Beta] has been released!!
mBDSR (Product ID 11836) Purchase Bonus】MT5 Version Indicator (Beta) "mBDSR (no filter, RCI filter, MA filter)"
https://www.gogojungle.co.jp/tools/indicators/56765
【Master RCI!! Trend Reversal, Buy on Dips, Sell on Rallies】
An indicator that shows its power when used in combination with RCI【BODSOR・mBDSR】
and techniques / case studies (PDF) ★Winner of the GogoJungle AWARD 2020★
https://www.gogojungle.co.jp/tools/indicators/11836
AUDUSD / AUDJPY 1-hour chart
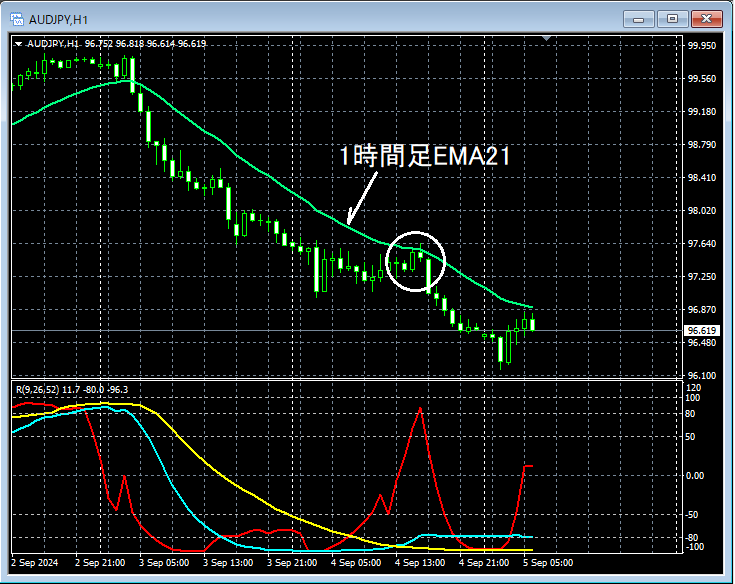
If you look at the area enclosed by the white circle on the above 1-hour chart,the important 1-hour EMA21has risen close to it, so it might not be strange to look for a selling on rallies. We will look for signs of reversal near the moving average line (in this case1-hour EMA21) on the lower-timeframe to see if there are signs of a reversal.
AUDJPY 5-minute chart
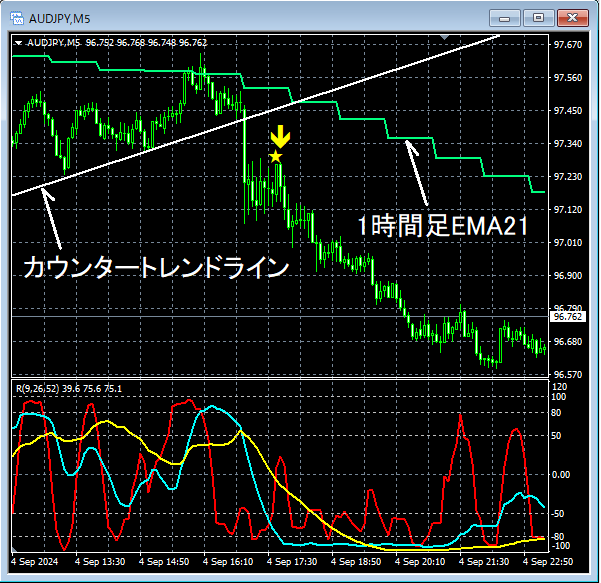
Looking at the above 5-minute chart1-hour EMA21reverses from near that area. AndCounter-trend linerises after breaking below,mBDSR (Filter: RCI26 and RCI52) Sell signallights up and price drops sharply.
From this example,a trading method focusing on reversals at moving averages and counter-trend linesandthe harmony with mBDSR signalsis evident.
※ Please note that in the charts introduced in this article, for readability, circles, straight lines, and squares may be drawn.
An indicator that shines when combined with RCI【BODSOR・mBDSR】
and techniques / case studies (PDF) ★Winner of the GogoJungle AWARD 2020★
https://www.gogojungle.co.jp/tools/indicators/11836
The PDF file includes 358 files (over 1,400 pages, over 470,000 characters).
Most of these are summaries of how to logically link higher and lower timeframes using three RCI lines, examining multiple lower-timeframe conditions step by step, and ultimately waiting for dip buying or rally selling timing (i.e., mBDSR signals) on the lower timeframes.
In addition,there are many that emphasize identifying points where multiple entry reasons align.as well.
Additionally,there are methods that explore upside targets and downside targets using three RCI lines.also included.
In the PDF explanations,more than 1,350 chartsare used.

mBDSR (Product ID 11836) Purchase Bonus】MT5 Version Indicator (Beta) "mBDSR (no filter, RCI filter, MA filter)"
https://www.gogojungle.co.jp/tools/indicators/56765
【Master RCI!! Trend Reversal, Buy on Dips, Sell on Rallies】
An indicator that shows its power when used in combination with RCI【BODSOR・mBDSR】
and techniques / case studies (PDF) ★Winner of the GogoJungle AWARD 2020★
https://www.gogojungle.co.jp/tools/indicators/11836
AUDUSD / AUDJPY 1-hour chart
If you look at the area enclosed by the white circle on the above 1-hour chart,the important 1-hour EMA21has risen close to it, so it might not be strange to look for a selling on rallies. We will look for signs of reversal near the moving average line (in this case1-hour EMA21) on the lower-timeframe to see if there are signs of a reversal.
AUDJPY 5-minute chart
Looking at the above 5-minute chart1-hour EMA21reverses from near that area. AndCounter-trend linerises after breaking below,mBDSR (Filter: RCI26 and RCI52) Sell signallights up and price drops sharply.
From this example,a trading method focusing on reversals at moving averages and counter-trend linesandthe harmony with mBDSR signalsis evident.
※ Please note that in the charts introduced in this article, for readability, circles, straight lines, and squares may be drawn.
An indicator that shines when combined with RCI【BODSOR・mBDSR】
and techniques / case studies (PDF) ★Winner of the GogoJungle AWARD 2020★
https://www.gogojungle.co.jp/tools/indicators/11836
The PDF file includes 358 files (over 1,400 pages, over 470,000 characters).
Most of these are summaries of how to logically link higher and lower timeframes using three RCI lines, examining multiple lower-timeframe conditions step by step, and ultimately waiting for dip buying or rally selling timing (i.e., mBDSR signals) on the lower timeframes.
In addition,there are many that emphasize identifying points where multiple entry reasons align.as well.
Additionally,there are methods that explore upside targets and downside targets using three RCI lines.also included.
In the PDF explanations,more than 1,350 chartsare used.
× ![]()


