

Previous high of the upper leg and R1R2S2 pullback selling signal
【Mastering RCI!! Trend Reversal, Buy on Dips, Sell on Rallies】
Indicator that shines when used in combination with RCI【BODSOR・mBDSR】
and methods・case studies (PDF) ★GogoJungle AWARD2020 winner★
https://www.gogojungle.co.jp/tools/indicators/11836
R1R2S2 is included in the above product. For details, please see the article below on Investment Navi+.
RCI 3-line “Two-stage Confirmation” to target trend reversals, buy on dips, and sell on rallies – Release of “R1R2S2”
Nikkei 225 JPX Daily
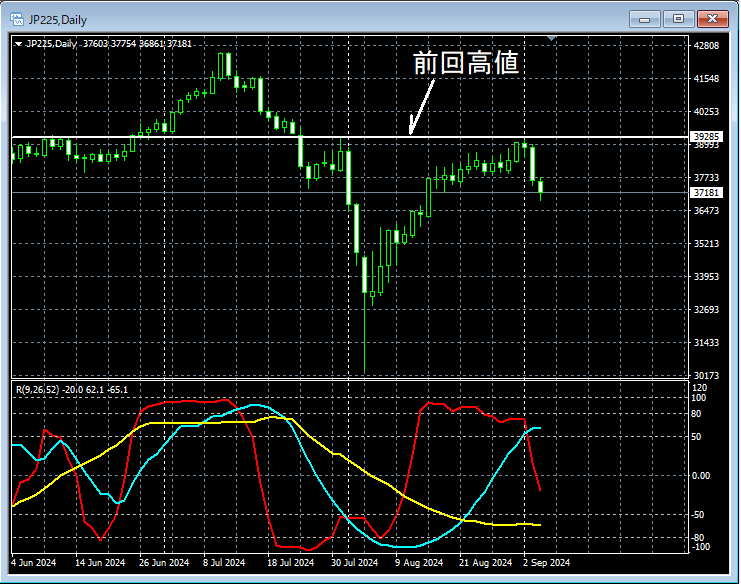
If you look at the area circled in white on the above daily chart,the line indicating the previous high (horizontal line)has risen nearby. If this line is treated as resistance, it might be a scene where buying on dips could be reasonable. We will carefully watch for any signs of reversal on lower timeframes.
Nikkei 225 JP225 1-hour chart
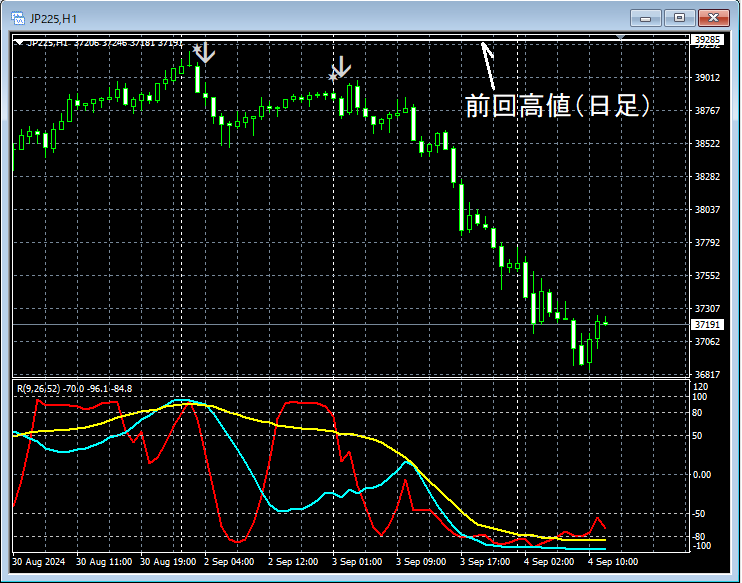
Looking at the 1-hour chart above,the line indicating the previous high on the daily levelis nearing a reversal. During the decline,the R1R2S2 sell signalslit up twice, and the price dropped sharply.
From this example,a trading method focusing on the previous high (horizontal line)and thesignals of R1R2S2show a strong compatibility.
※ Please note that in the charts introduced in this article, for convenience of explanation, circles, straight lines, and rectangles may be drawn.
Indicator that shines in combination with RCI【BODSOR・mBDSR】
and methods・case studies (PDF) ★GogoJungle AWARD2020 winner★
https://www.gogojungle.co.jp/tools/indicators/11836
PDF files are attached: 358 files (total over 1,400 pages, over 470,000 characters).
Many of them are aboutanalyzed by logically linking the higher and lower timeframes using the RCI three-line setup, and ultimately waiting for dips or pullbacks on the lower timeframes (i.e., signals of mBDSR) as a form to summarizethese examples.
Additionally,there are many that focus on pinpointing points where multiple entry reasons overlap..
Moreover,there are methods that explore upward and downward targets using the RCI three-line setup..
In the PDF explanations,over 1,350 chartsare used.

Indicator that shines when used in combination with RCI【BODSOR・mBDSR】
and methods・case studies (PDF) ★GogoJungle AWARD2020 winner★
https://www.gogojungle.co.jp/tools/indicators/11836
R1R2S2 is included in the above product. For details, please see the article below on Investment Navi+.
RCI 3-line “Two-stage Confirmation” to target trend reversals, buy on dips, and sell on rallies – Release of “R1R2S2”
Nikkei 225 JPX Daily
If you look at the area circled in white on the above daily chart,the line indicating the previous high (horizontal line)has risen nearby. If this line is treated as resistance, it might be a scene where buying on dips could be reasonable. We will carefully watch for any signs of reversal on lower timeframes.
Nikkei 225 JP225 1-hour chart
Looking at the 1-hour chart above,the line indicating the previous high on the daily levelis nearing a reversal. During the decline,the R1R2S2 sell signalslit up twice, and the price dropped sharply.
From this example,a trading method focusing on the previous high (horizontal line)and thesignals of R1R2S2show a strong compatibility.
※ Please note that in the charts introduced in this article, for convenience of explanation, circles, straight lines, and rectangles may be drawn.
Indicator that shines in combination with RCI【BODSOR・mBDSR】
and methods・case studies (PDF) ★GogoJungle AWARD2020 winner★
https://www.gogojungle.co.jp/tools/indicators/11836
PDF files are attached: 358 files (total over 1,400 pages, over 470,000 characters).
Many of them are aboutanalyzed by logically linking the higher and lower timeframes using the RCI three-line setup, and ultimately waiting for dips or pullbacks on the lower timeframes (i.e., signals of mBDSR) as a form to summarizethese examples.
Additionally,there are many that focus on pinpointing points where multiple entry reasons overlap..
Moreover,there are methods that explore upward and downward targets using the RCI three-line setup..
In the PDF explanations,over 1,350 chartsare used.
× ![]()


