

Utilize both the sign of the mBDSR (RCI2 high-pass filter) and the sign of R1R2S2 (3)
Indicator "RCI-based catch of Tendance Bottom/Trend Reversal" for the combination with RCI: mBDSR
Method & Case Studies (PDF) ★GogoJungle AWARD 2020 winner★
https://www.gogojungle.co.jp/tools/indicators/11836
The above products include 301 PDFs (methods, case studies, etc.). For a list of the PDF titles, please refer to the article below.
About the 301 PDF files included with 【BODSOR・mBDSR】
https://www.gogojungle.co.jp/finance/navi/articles/34271
R1R2S2 is included in the above product. For details, please read the article below in Investment Navi+.
Release of the indicator "R1R2S2" that targets trend reversal, pullbacks, and pullback selling with the 3-line RCI
Below,mBDSR (RCI two-line filter)andR1R2S2signals are shown together as an example.
EURCAD - Euro / Canadian dollar 5-minute chart
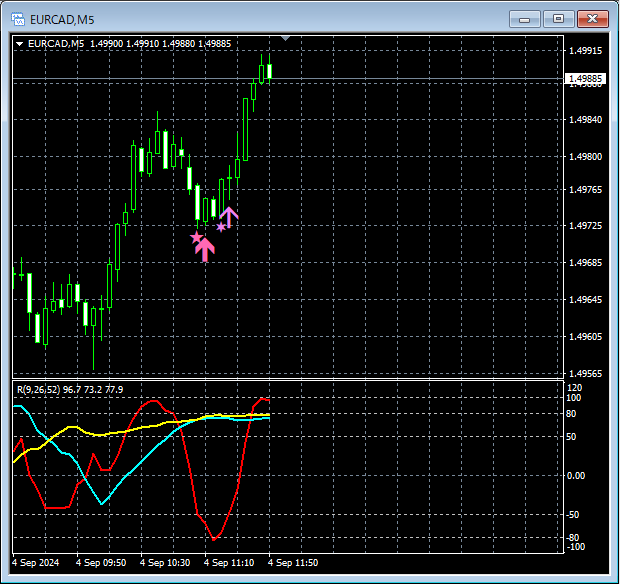
mBDSR (RCI two-line filter)andR1R2S2signals
In the above 5-minute chart,the signal of mBDSR (RCI two-line filter)lights up first,then the signal of R1R2S2lights up.
In this way,the signal of mBDSR (RCI two-line filter)is awaited, and if the signal is missed or delayed,the signal of R1R2S2may serve as a remedy.
An indicator that shines when combined with RCI: 【BODSOR・mBDSR】
Method & Case Studies (PDF) ★GogoJungle AWARD 2020 winner★
https://www.gogojungle.co.jp/tools/indicators/11836
PDF files number 301 (over 1,000 pages, over 350,000 characters in total).
Most of them describe an approach where the three RCI lines logically link the higher and lower timeframes, sequentially considering multiple lower-timeframe situations, and ultimately waiting for pullbacks (i.e., mBDSR signals) on the lower timeframe.
Additionally,many emphasize identifying points where multiple entry rationale overlap.There are many such cases.
The explanations useover 1,000 charts.

Method & Case Studies (PDF) ★GogoJungle AWARD 2020 winner★
https://www.gogojungle.co.jp/tools/indicators/11836
The above products include 301 PDFs (methods, case studies, etc.). For a list of the PDF titles, please refer to the article below.
About the 301 PDF files included with 【BODSOR・mBDSR】
https://www.gogojungle.co.jp/finance/navi/articles/34271
R1R2S2 is included in the above product. For details, please read the article below in Investment Navi+.
Release of the indicator "R1R2S2" that targets trend reversal, pullbacks, and pullback selling with the 3-line RCI
Below,mBDSR (RCI two-line filter)andR1R2S2signals are shown together as an example.
EURCAD - Euro / Canadian dollar 5-minute chart
mBDSR (RCI two-line filter)andR1R2S2signals
In the above 5-minute chart,the signal of mBDSR (RCI two-line filter)lights up first,then the signal of R1R2S2lights up.
In this way,the signal of mBDSR (RCI two-line filter)is awaited, and if the signal is missed or delayed,the signal of R1R2S2may serve as a remedy.
An indicator that shines when combined with RCI: 【BODSOR・mBDSR】
Method & Case Studies (PDF) ★GogoJungle AWARD 2020 winner★
https://www.gogojungle.co.jp/tools/indicators/11836
PDF files number 301 (over 1,000 pages, over 350,000 characters in total).
Most of them describe an approach where the three RCI lines logically link the higher and lower timeframes, sequentially considering multiple lower-timeframe situations, and ultimately waiting for pullbacks (i.e., mBDSR signals) on the lower timeframe.
Additionally,many emphasize identifying points where multiple entry rationale overlap.There are many such cases.
The explanations useover 1,000 charts.
× ![]()


