

Utilize both the sign of mBDSR (RCI2 single-band filter) and the sign of R1R2S2 (2)
Indicator that captures the market bottom and reversal in combination with RCI: 【mBDSR】
Method and Case Studies (PDF) ★GogoJungle AWARD2020 Winner★
https://www.gogojungle.co.jp/tools/indicators/11836
The above product includes 301 PDFs (methods, case studies, etc.). For the list of the PDF titles, please see the article below.
About the 301 PDF files included with 【BODSOR・mBDSR】
https://www.gogojungle.co.jp/finance/navi/articles/34271
R1R2S2 is included in the above product. For details, please see the investment guide+ article below.
RCI three-line “two-step decision” to target trend reversals, buy on dips, and sell on rallies: Indicator “R1R2S2” released!!
Below willintroduce the signs of mBDSR (RCI two-line filter)andR1R2S2displayed simultaneously.
AUDCAD 15-minute chart (Australia/Canada)
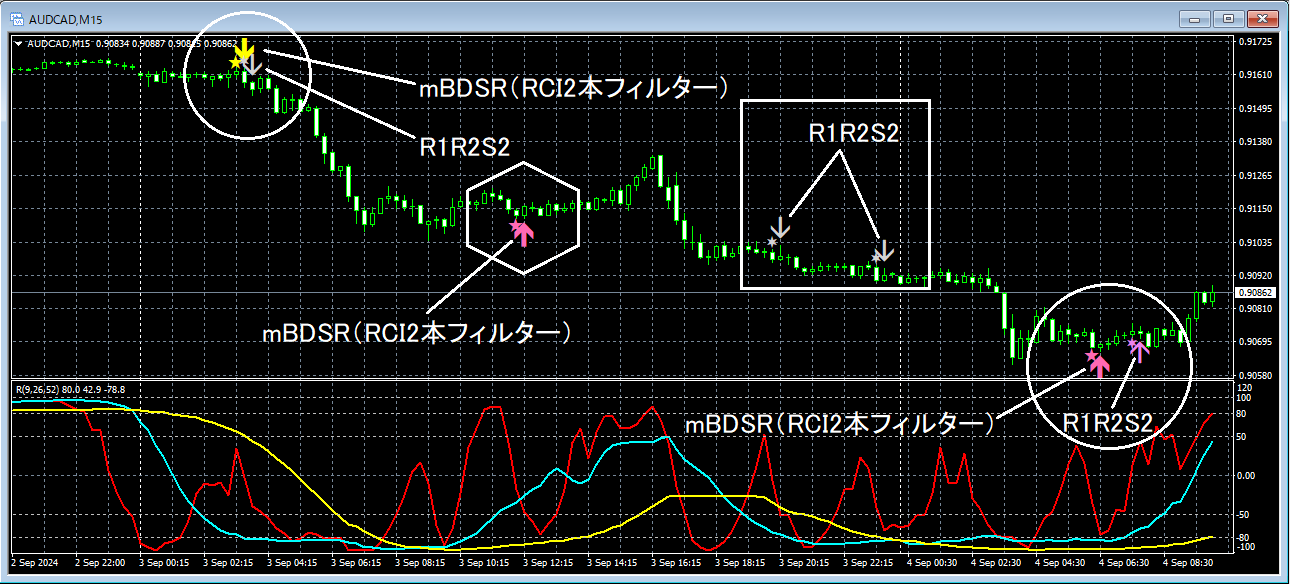
mBDSR (RCI two-line filter)andR1R2S2signs
In the area surrounded by a white hexagon, only the signal from mBDSR (RCI two-line filter) is lit, but in the area surrounded by a white circle,the signal from mBDSR (RCI two-line filter)lights up, followed bythe signal from R1R2S2lighting up. Also, in the area surrounded by a white square,only the signal from R1R2S2lights up.
Thus,the signal from mBDSR (RCI two-line filter)is awaited, andif the mBDSR signal is missed or delayed, or ifthe mBDSR signal does not light up,there are cases where the R1R2S2 signalcan be used to respond.
Indicator【BODSOR・mBDSR】that shines in combination with RCI
Method and Case Studies (PDF) ★GogoJungle AWARD2020 Winner★
https://www.gogojungle.co.jp/tools/indicators/11836
The PDF files amount to 301 items (over 1,000 pages, over 350,000 characters in total).
Many of these areexamples that logically link higher and lower timeframes using an RCI three-line setup to examine multiple lower-timeframe conditions sequentially, ultimately waiting for timing to buy on dips or sell on rallies on the lower timeframe (i.e., mBDSR signals)..
Also,there are many that focus on capturing points where multiple entry reasons overlap..
The explanations usemore than 1,000 charts..

Method and Case Studies (PDF) ★GogoJungle AWARD2020 Winner★
https://www.gogojungle.co.jp/tools/indicators/11836
The above product includes 301 PDFs (methods, case studies, etc.). For the list of the PDF titles, please see the article below.
About the 301 PDF files included with 【BODSOR・mBDSR】
https://www.gogojungle.co.jp/finance/navi/articles/34271
R1R2S2 is included in the above product. For details, please see the investment guide+ article below.
RCI three-line “two-step decision” to target trend reversals, buy on dips, and sell on rallies: Indicator “R1R2S2” released!!
Below willintroduce the signs of mBDSR (RCI two-line filter)andR1R2S2displayed simultaneously.
AUDCAD 15-minute chart (Australia/Canada)
mBDSR (RCI two-line filter)andR1R2S2signs
In the area surrounded by a white hexagon, only the signal from mBDSR (RCI two-line filter) is lit, but in the area surrounded by a white circle,the signal from mBDSR (RCI two-line filter)lights up, followed bythe signal from R1R2S2lighting up. Also, in the area surrounded by a white square,only the signal from R1R2S2lights up.
Thus,the signal from mBDSR (RCI two-line filter)is awaited, andif the mBDSR signal is missed or delayed, or ifthe mBDSR signal does not light up,there are cases where the R1R2S2 signalcan be used to respond.
Indicator【BODSOR・mBDSR】that shines in combination with RCI
Method and Case Studies (PDF) ★GogoJungle AWARD2020 Winner★
https://www.gogojungle.co.jp/tools/indicators/11836
The PDF files amount to 301 items (over 1,000 pages, over 350,000 characters in total).
Many of these areexamples that logically link higher and lower timeframes using an RCI three-line setup to examine multiple lower-timeframe conditions sequentially, ultimately waiting for timing to buy on dips or sell on rallies on the lower timeframe (i.e., mBDSR signals)..
Also,there are many that focus on capturing points where multiple entry reasons overlap..
The explanations usemore than 1,000 charts..
× ![]()


