

[Chart Research] 2B Reversal and R1R2S2 Return Sell Signal
【Mastering RCI!! Trend Reversal, Buy Dips, Sell on Rallies】
Indicator【BODSOR・mBDSR】that shines when combined with RCI
and method, case studies (PDF) ★GogoJungle AWARD2020 winner★
https://www.gogojungle.co.jp/tools/indicators/11836
R1R2S2 is included in the above product. For details, please see the article below in Investment Navigator+.
RCI 3-line “two-stage confirmation” to target trend reversal, buy the dips, and sell on rallies — R1R2S2 released!!
AUD/JPY 1-hour chart
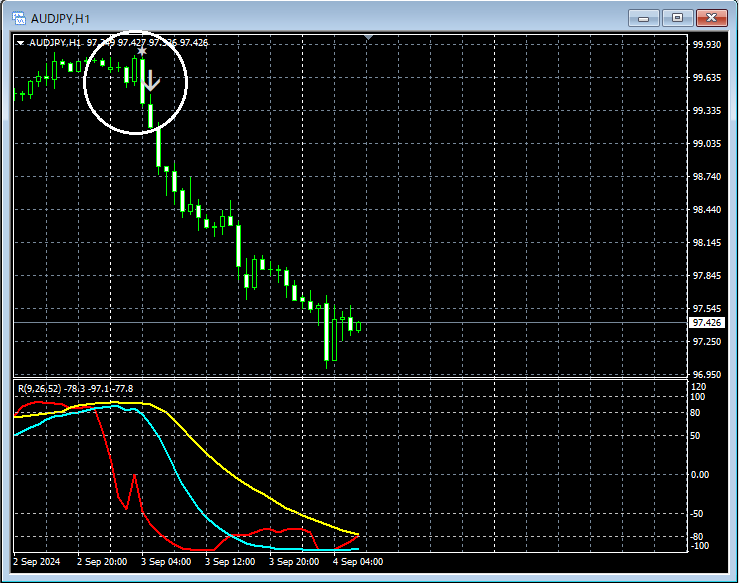
Looking at the area circled in white on the 1-hour chart above, it suggests a decline2B Reversal (Two-Be Reversal)appears. And immediately after thatthe sell signal of R1R2S2lights up and the price falls sharply.
From this example,a trading method focused on 2B Reversal (Two-Be Reversal)andthe signals of R1R2S2 show a high degree of compatibility.
※Please note that, for convenience in explanations, charts in this article may include added circles, lines, or rectangles.
Indicator【BODSOR・mBDSR】that shines when combined with RCI
and method, case studies (PDF) ★GogoJungle AWARD2020 winner★
https://www.gogojungle.co.jp/tools/indicators/11836
The PDF file includes 358 files (over 1,400 pages, over 470,000 characters in total).
Most of them are compiled as examples that logically link the higher and lower timeframes using the 3-line RCI, sequentially considering the situations of multiple lower timeframes, and ultimately waiting for dip buys or rally sells (i.e., the signal of mBDSR) on the lower timeframes.
Also,many focus on capturing points where multiple entry reasons overlap..
Additionally,there are methods that explore upside targets and downside targets using the 3-line RCI as well..
In the PDFs,more than 1,350 chartsare used.

Indicator【BODSOR・mBDSR】that shines when combined with RCI
and method, case studies (PDF) ★GogoJungle AWARD2020 winner★
https://www.gogojungle.co.jp/tools/indicators/11836
R1R2S2 is included in the above product. For details, please see the article below in Investment Navigator+.
RCI 3-line “two-stage confirmation” to target trend reversal, buy the dips, and sell on rallies — R1R2S2 released!!
AUD/JPY 1-hour chart
Looking at the area circled in white on the 1-hour chart above, it suggests a decline2B Reversal (Two-Be Reversal)appears. And immediately after thatthe sell signal of R1R2S2lights up and the price falls sharply.
From this example,a trading method focused on 2B Reversal (Two-Be Reversal)andthe signals of R1R2S2 show a high degree of compatibility.
※Please note that, for convenience in explanations, charts in this article may include added circles, lines, or rectangles.
Indicator【BODSOR・mBDSR】that shines when combined with RCI
and method, case studies (PDF) ★GogoJungle AWARD2020 winner★
https://www.gogojungle.co.jp/tools/indicators/11836
The PDF file includes 358 files (over 1,400 pages, over 470,000 characters in total).
Most of them are compiled as examples that logically link the higher and lower timeframes using the 3-line RCI, sequentially considering the situations of multiple lower timeframes, and ultimately waiting for dip buys or rally sells (i.e., the signal of mBDSR) on the lower timeframes.
Also,many focus on capturing points where multiple entry reasons overlap..
Additionally,there are methods that explore upside targets and downside targets using the 3-line RCI as well..
In the PDFs,more than 1,350 chartsare used.
× ![]()


