

Consider the response on the lower timeframe after a short-selling signal appears on the higher timeframe mBDSR (RCI2 two-filter) (1)
【MT5 Version Beta】 has been released!!
mBDSR (Product ID 11836) Purchase Bonus】 MT5 Indicator (Beta) “mBDSR (no filter, RCI filter, MA filter)”
https://www.gogojungle.co.jp/tools/indicators/56765
【Master RCI!! Trend reversal, Pullback buying, Pullback selling】
An indicator that shines when used in combination with RCI【BODSOR・mBDSR】
and methods, case studies (PDF) ★GogoJungle AWARD2020 Winner★
https://www.gogojungle.co.jp/tools/indicators/11836
AUDUSD 4-hour
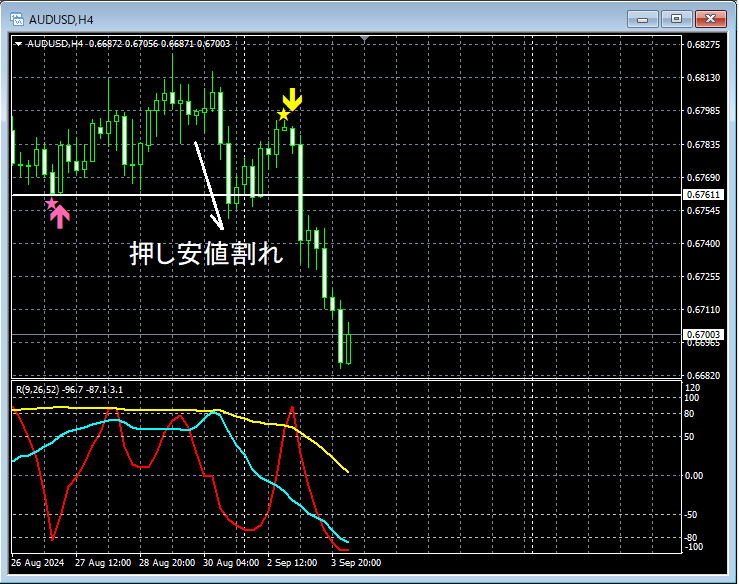
Looking at the 4-hour abovebreak of previous swing lowwith the subsequent risemBDSR (filters: RCI26 and RCI52) pullback sell signallights up. We will check for pullback selling timing on lower timeframes.
AUDUSD 15-minute
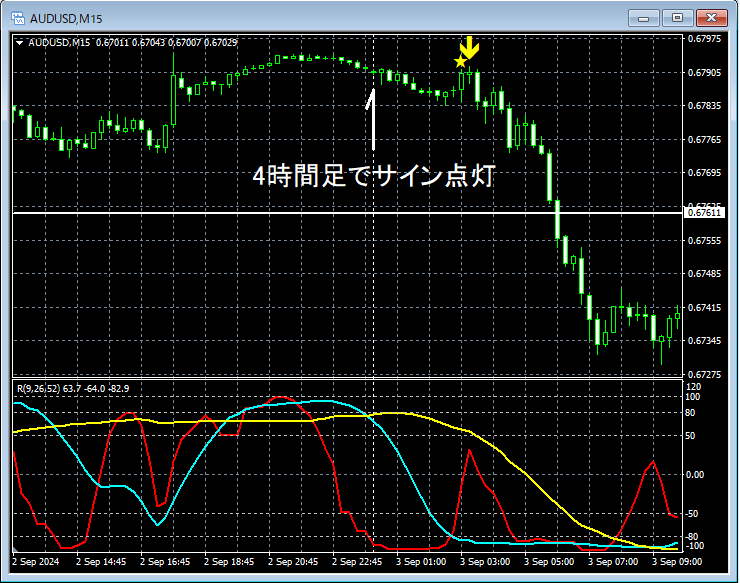
As seen on the 15-minute after the 4-hour signal, on the 15-minute as wellmBDSR (filters: RCI26 and RCI52) pullback sell signallights up and price drops substantially.
From this example,a trading approach focused on pullback lows (Dow Theory)andthe harmony with mBDSR signalsis evident.
Also in this example, by placing the stop loss slightly above the most recent highand other measuresa trade with favorable risk-reward is possible.
※ Please note that in this article, charts may include added circles, lines, or rectangles for clarity.
An indicator that shines when used with RCI【BODSOR・mBDSR】
and methods, case studies (PDF) ★GogoJungle AWARD2020 Winner★
https://www.gogojungle.co.jp/tools/indicators/11836
The PDF file includes 358 items (over 1,400 pages, over 470,000 characters).
Many of thesedocument how to logically link higher and lower timeframes using the RCI three-line setup, gradually examining multiple lower-timeframe conditions, and ultimately waiting for pullbacks or pullback selling signals on the lower timeframe (i.e., mBDSR signals)..
Additionally,many focus on identifying points where multiple entry factors coincide..
Also included is a method to explore upside and downside targets using the RCI three-line setup.
In the PDF explanations,more than 1,350 chartsare used.

mBDSR (Product ID 11836) Purchase Bonus】 MT5 Indicator (Beta) “mBDSR (no filter, RCI filter, MA filter)”
https://www.gogojungle.co.jp/tools/indicators/56765
【Master RCI!! Trend reversal, Pullback buying, Pullback selling】
An indicator that shines when used in combination with RCI【BODSOR・mBDSR】
and methods, case studies (PDF) ★GogoJungle AWARD2020 Winner★
https://www.gogojungle.co.jp/tools/indicators/11836
AUDUSD 4-hour
Looking at the 4-hour abovebreak of previous swing lowwith the subsequent risemBDSR (filters: RCI26 and RCI52) pullback sell signallights up. We will check for pullback selling timing on lower timeframes.
AUDUSD 15-minute
As seen on the 15-minute after the 4-hour signal, on the 15-minute as wellmBDSR (filters: RCI26 and RCI52) pullback sell signallights up and price drops substantially.
From this example,a trading approach focused on pullback lows (Dow Theory)andthe harmony with mBDSR signalsis evident.
Also in this example, by placing the stop loss slightly above the most recent highand other measuresa trade with favorable risk-reward is possible.
※ Please note that in this article, charts may include added circles, lines, or rectangles for clarity.
An indicator that shines when used with RCI【BODSOR・mBDSR】
and methods, case studies (PDF) ★GogoJungle AWARD2020 Winner★
https://www.gogojungle.co.jp/tools/indicators/11836
The PDF file includes 358 items (over 1,400 pages, over 470,000 characters).
Many of thesedocument how to logically link higher and lower timeframes using the RCI three-line setup, gradually examining multiple lower-timeframe conditions, and ultimately waiting for pullbacks or pullback selling signals on the lower timeframe (i.e., mBDSR signals)..
Additionally,many focus on identifying points where multiple entry factors coincide..
Also included is a method to explore upside and downside targets using the RCI three-line setup.
In the PDF explanations,more than 1,350 chartsare used.
× ![]()


