

[If you want to chase trends...] mBDSR (Moving Average Filter) signals and GMMA from today's chart (September 4, 2024)
0
Indicator that captures “tops/bottoms and reversals” in combination with RCI: [mBDSR]
Method and Case Study (PDF) ★GogoJungle AWARD2020 winner★
https://www.gogojungle.co.jp/tools/indicators/11836
The above product includes 301 PDFs (methods, case studies, etc.). For a list of the PDF titles, please see the article below.
About the 301 PDF files included with [BODSOR・mBDSR]
https://www.gogojungle.co.jp/finance/navi/articles/34271
mBDSR (RCI filter)andmBDSR (Moving Average filter)play different roles. The differences in usage are also discussed in the above PDFs.
Below,mBDSR (Moving Average filter)sign examples are introduced.
NZD/JPY, NZDJPY, 15-minute chart
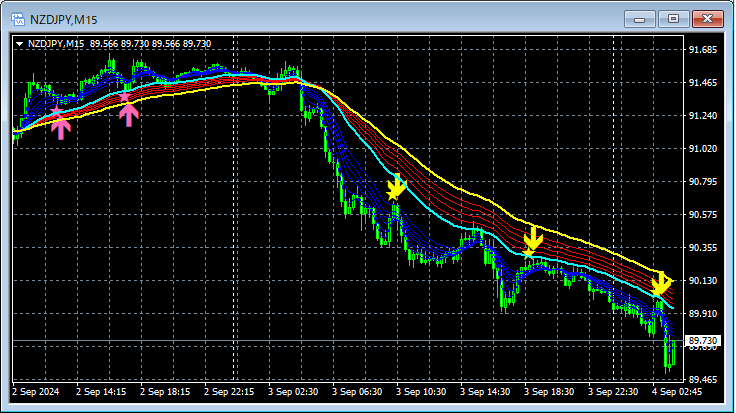
signs of mBDSR (two moving average filters)andGMMA
Indicator that shines when combined with RCI: 【BODSOR・mBDSR】
Method and Case Study (PDF) ★GogoJungle AWARD2020 winner★
https://www.gogojungle.co.jp/tools/indicators/11836
The PDF package includes 301 files (over 1,000 pages, over 350,000 characters in total).
Many of them are built around logically linking higher and lower timeframes using the three RCI lines, sequentially considering conditions across multiple lower timeframes, and ultimately waiting for lower-timeframe entry signals (i.e., mBDSR signals) such as buying on dips or selling on rallies.
Additionally,there are many that emphasize identifying points where multiple entry criteria overlap..
The explanations useover 1,000 charts.

Method and Case Study (PDF) ★GogoJungle AWARD2020 winner★
https://www.gogojungle.co.jp/tools/indicators/11836
The above product includes 301 PDFs (methods, case studies, etc.). For a list of the PDF titles, please see the article below.
About the 301 PDF files included with [BODSOR・mBDSR]
https://www.gogojungle.co.jp/finance/navi/articles/34271
mBDSR (RCI filter)andmBDSR (Moving Average filter)play different roles. The differences in usage are also discussed in the above PDFs.
Below,mBDSR (Moving Average filter)sign examples are introduced.
NZD/JPY, NZDJPY, 15-minute chart
signs of mBDSR (two moving average filters)andGMMA
Indicator that shines when combined with RCI: 【BODSOR・mBDSR】
Method and Case Study (PDF) ★GogoJungle AWARD2020 winner★
https://www.gogojungle.co.jp/tools/indicators/11836
The PDF package includes 301 files (over 1,000 pages, over 350,000 characters in total).
Many of them are built around logically linking higher and lower timeframes using the three RCI lines, sequentially considering conditions across multiple lower timeframes, and ultimately waiting for lower-timeframe entry signals (i.e., mBDSR signals) such as buying on dips or selling on rallies.
Additionally,there are many that emphasize identifying points where multiple entry criteria overlap..
The explanations useover 1,000 charts.
× ![]()


