

Buy signal for pullback in bullish price action: push low, pin bar, double bottom, and mBDSR (RCI two-filter)
【MT5 Version Beta】 has been released!!
mBDSR (Product ID 11836) Purchase Bonus】MT5 Version Indicator (Beta) “mBDSR (No Filter, RCI Filter, MA Filter)”
https://www.gogojungle.co.jp/tools/indicators/56765
【Master RCI!! Trend Reversal, Buy Dips, Sell Rallies】
An indicator that shines when combined with RCI【BODSOR・mBDSR】
and techniques, case studies (PDF) ★GogoJungle AWARD2020 winner★
https://www.gogojungle.co.jp/tools/indicators/11836
Swiss Franc to Japanese Yen CHFJPY 1-hour chart
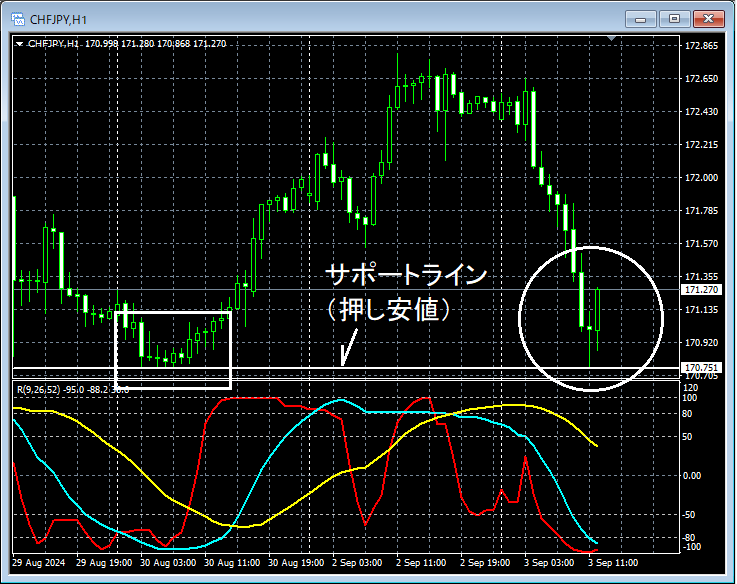
Looking at the area circled in white on the 1-hour chart above, it may function as supportPullback Lowand indicate a potential rise when it declines to that levelPin Bar (long lower shadow candle)appears, suggesting it might not be strange to consider buying on the dips on a lower time frame. In this case,Pin Baris a pattern where traders who jumped in during a strong decline are trapped. Public sentiment may be interpreted as turning upward (bullish).
Swiss Franc to Japanese Yen CHFJPY 15-minute chart
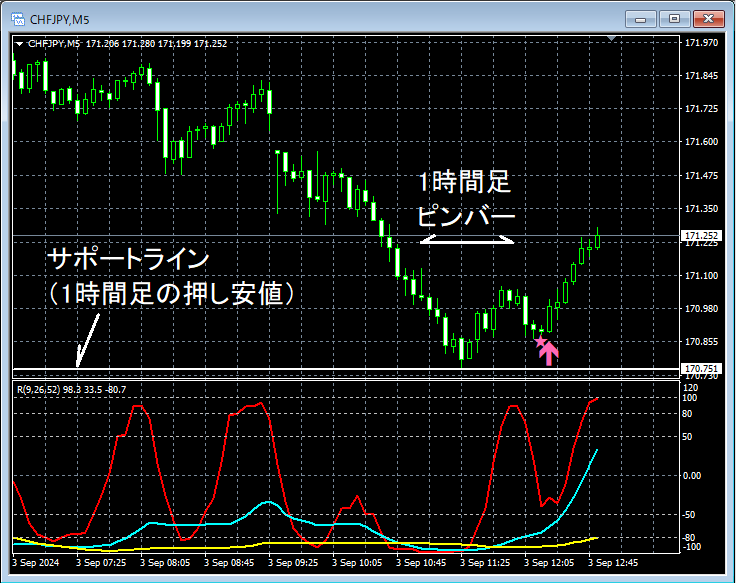
On the above 5-minute chart, since aPin Bar (long lower shadow candle)has appeared on the 1-hour chart, it may be a scene where the price could rise without breaking the lows, forming aDouble Bottomand rising. Consequently,Double Bottomthe timing of the rise on the right-side trough can be well captured by themBDSR (RCI two-filter) Buy the Dip Signal.
From this example,a trading method focusing on Pin Bars and Double BottomsandmBDSR signalsshow high compatibility.
Also in this example, by placing the stop loss just below the recent low (the left trough of the double bottom), a high risk-reward trade is possible.
※Please note that the charts introduced in this article may have drawings such as circles, lines, and rectangles added for readability.
An indicator that shines when combined with RCI【BODSOR・mBDSR】
and techniques, case studies (PDF) ★GogoJungle AWARD2020 winner★
https://www.gogojungle.co.jp/tools/indicators/11836
The PDF file comes with 358 items (over 1,400 pages, over 470,000 words).
Most of them are,examples that link higher and lower time frames logically using the three-line RCI, examining multiple lower-time frames sequentially, and ultimately waiting for a dip buy or pullback sell timing (the mBDSR signal) on the lower time frame.This is what they are about.
Also,many standpoints focus on identifying points where multiple entry premises coincide.
In addition,there are methods that explore ascent targets or descent targets using three-line RCI.
In the PDF explanations,more than 1,350 chartsare used.

mBDSR (Product ID 11836) Purchase Bonus】MT5 Version Indicator (Beta) “mBDSR (No Filter, RCI Filter, MA Filter)”
https://www.gogojungle.co.jp/tools/indicators/56765
【Master RCI!! Trend Reversal, Buy Dips, Sell Rallies】
An indicator that shines when combined with RCI【BODSOR・mBDSR】
and techniques, case studies (PDF) ★GogoJungle AWARD2020 winner★
https://www.gogojungle.co.jp/tools/indicators/11836
Swiss Franc to Japanese Yen CHFJPY 1-hour chart
Looking at the area circled in white on the 1-hour chart above, it may function as supportPullback Lowand indicate a potential rise when it declines to that levelPin Bar (long lower shadow candle)appears, suggesting it might not be strange to consider buying on the dips on a lower time frame. In this case,Pin Baris a pattern where traders who jumped in during a strong decline are trapped. Public sentiment may be interpreted as turning upward (bullish).
Swiss Franc to Japanese Yen CHFJPY 15-minute chart
On the above 5-minute chart, since aPin Bar (long lower shadow candle)has appeared on the 1-hour chart, it may be a scene where the price could rise without breaking the lows, forming aDouble Bottomand rising. Consequently,Double Bottomthe timing of the rise on the right-side trough can be well captured by themBDSR (RCI two-filter) Buy the Dip Signal.
From this example,a trading method focusing on Pin Bars and Double BottomsandmBDSR signalsshow high compatibility.
Also in this example, by placing the stop loss just below the recent low (the left trough of the double bottom), a high risk-reward trade is possible.
※Please note that the charts introduced in this article may have drawings such as circles, lines, and rectangles added for readability.
An indicator that shines when combined with RCI【BODSOR・mBDSR】
and techniques, case studies (PDF) ★GogoJungle AWARD2020 winner★
https://www.gogojungle.co.jp/tools/indicators/11836
The PDF file comes with 358 items (over 1,400 pages, over 470,000 words).
Most of them are,examples that link higher and lower time frames logically using the three-line RCI, examining multiple lower-time frames sequentially, and ultimately waiting for a dip buy or pullback sell timing (the mBDSR signal) on the lower time frame.This is what they are about.
Also,many standpoints focus on identifying points where multiple entry premises coincide.
In addition,there are methods that explore ascent targets or descent targets using three-line RCI.
In the PDF explanations,more than 1,350 chartsare used.
× ![]()


