

【If you chase trends...】mBDSR (Moving Average Filter) signals and GMMA From today's chart (September 3, 2024) (USD/JPY, AUD/JPY, and others)
0
Indicator that captures the bottom/top reversal in combination with RCI: 【mBDSR】
Methods and Case Studies (PDF) ★GogoJungle AWARD2020 Winner★
https://www.gogojungle.co.jp/tools/indicators/11836
The above product includes 301 PDFs (methods, case studies, etc.). For a list of the PDF titles, please refer to the article below.
About the 301 PDF files included with 【BODSOR・mBDSR】
https://www.gogojungle.co.jp/finance/navi/articles/34271
mBDSR (RCI Filter)andmBDSR (Moving Average Filter)have different roles. The usage distinctions are also discussed in the PDF above.
BelowmBDSR (Moving Average Filter)sign examples are introduced.
USD/JPY - Five-minute chart
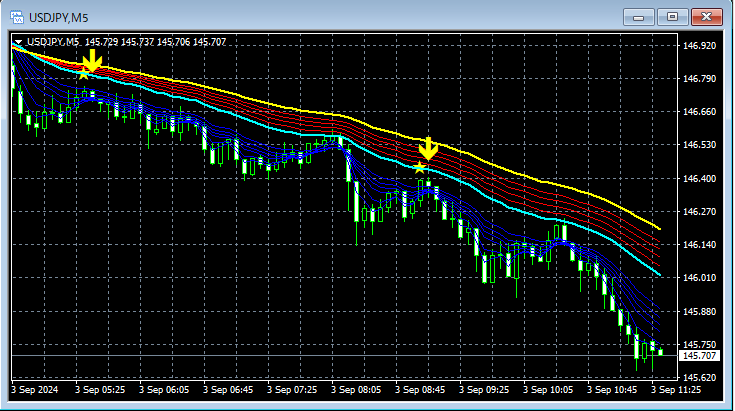
Sign of mBDSR (two moving average filters)andGMMA
AUD/JPY - 15-minute chart
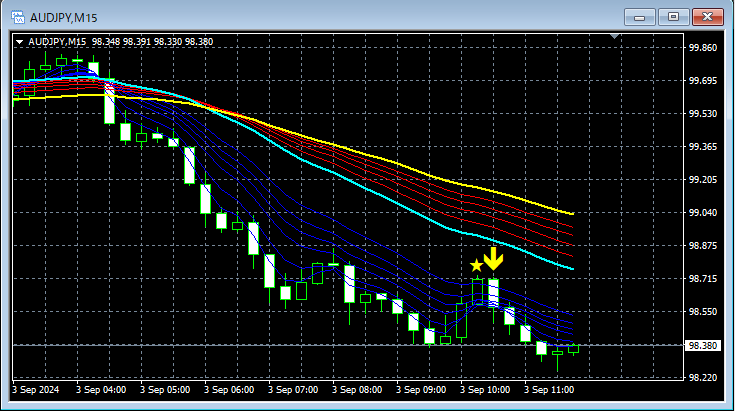
Sign of mBDSR (two moving average filters)andGMMA
GBP/JPY - 15-minute chart
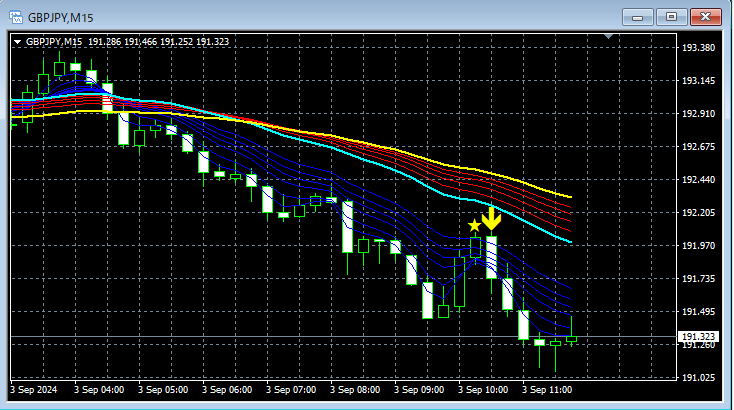
Sign of mBDSR (two moving average filters)andGMMA
NZD/JPY - 15-minute chart
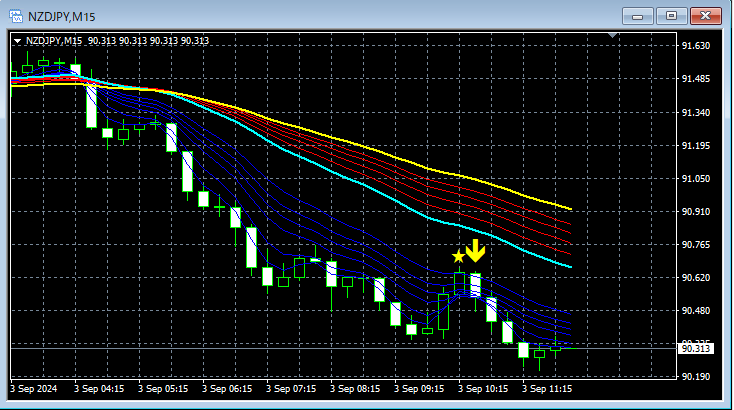
Sign of mBDSR (two moving average filters)andGMMA
CAD/JPY - 15-minute chart
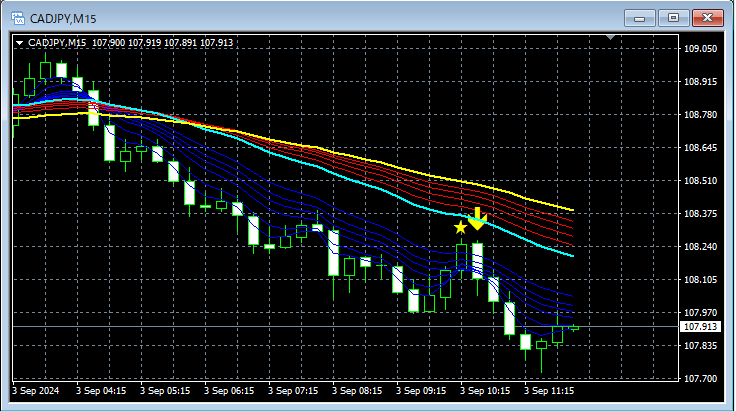
Sign of mBDSR (two moving average filters)andGMMA
Indicator that shines when combined with RCI: 【BODSOR・mBDSR】
Methods and Case Studies (PDF) ★GogoJungle AWARD2020 Winner★
https://www.gogojungle.co.jp/tools/indicators/11836
The PDF files total 301 (over 1,000 pages, over 350,000 characters).
Many of them are cases where, by logically linking higher and lower timeframes using three RCI lines, the situations of multiple lower timeframes are examined step by step, ultimately waiting for a pullback buy or a pullback sell timing on the lower timeframe (i.e., the mBDSR signal).Additionally,
many of them focus on capturing points where multiple entry reasons overlap.There are many such examples.
In the explanations,over 1,000 chartsare used.

Methods and Case Studies (PDF) ★GogoJungle AWARD2020 Winner★
https://www.gogojungle.co.jp/tools/indicators/11836
The above product includes 301 PDFs (methods, case studies, etc.). For a list of the PDF titles, please refer to the article below.
About the 301 PDF files included with 【BODSOR・mBDSR】
https://www.gogojungle.co.jp/finance/navi/articles/34271
mBDSR (RCI Filter)andmBDSR (Moving Average Filter)have different roles. The usage distinctions are also discussed in the PDF above.
BelowmBDSR (Moving Average Filter)sign examples are introduced.
USD/JPY - Five-minute chart
Sign of mBDSR (two moving average filters)andGMMA
AUD/JPY - 15-minute chart
Sign of mBDSR (two moving average filters)andGMMA
GBP/JPY - 15-minute chart
Sign of mBDSR (two moving average filters)andGMMA
NZD/JPY - 15-minute chart
Sign of mBDSR (two moving average filters)andGMMA
CAD/JPY - 15-minute chart
Sign of mBDSR (two moving average filters)andGMMA
Indicator that shines when combined with RCI: 【BODSOR・mBDSR】
Methods and Case Studies (PDF) ★GogoJungle AWARD2020 Winner★
https://www.gogojungle.co.jp/tools/indicators/11836
The PDF files total 301 (over 1,000 pages, over 350,000 characters).
Many of them are cases where, by logically linking higher and lower timeframes using three RCI lines, the situations of multiple lower timeframes are examined step by step, ultimately waiting for a pullback buy or a pullback sell timing on the lower timeframe (i.e., the mBDSR signal).Additionally,
many of them focus on capturing points where multiple entry reasons overlap.There are many such examples.
In the explanations,over 1,000 chartsare used.
× ![]()


