

Buy signal on past resistance line, moving average, and mBDSR (RCI two-filter) pullback
【MT5 Version Beta】 has been released!!
mBDSR (Product ID 11836) Purchase Bonus】 MT5 Version Indicator (Beta) “mBDSR (No Filter, RCI Filter, MA Filter)”
https://www.gogojungle.co.jp/tools/indicators/56765
【Master RCI!! Trend Reversal, Buy on Dips, Sell on Rallies】
An indicator that shines when combined with RCI【BODSOR・mBDSR】
and methods & case studies (PDF) ★Winner of GogoJungle AWARD2020★
https://www.gogojungle.co.jp/tools/indicators/11836
GBP/NZD, 1-hour chart
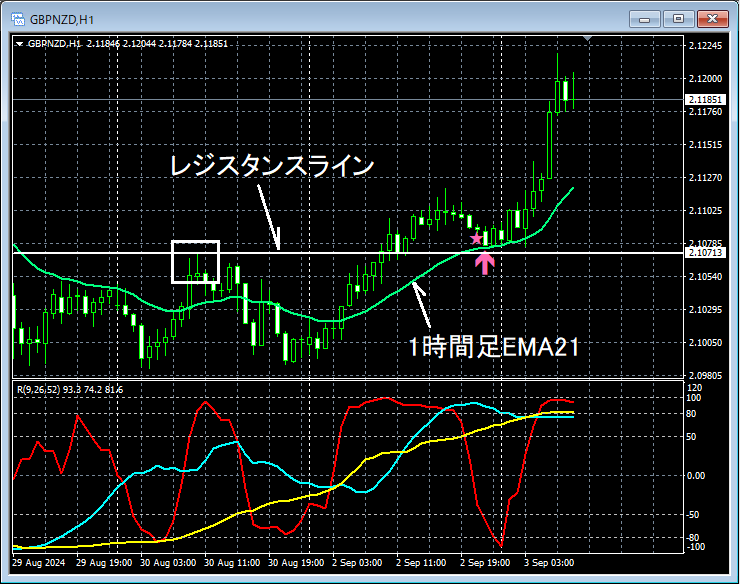
In the 1-hour chart above,Resistance lineis breached upward, and then around where1-hour EMA21converges with that linemBDSR (2-filter RCI) Buy-the-dip signallights up, and afterward, the price rises smoothly (a so-calledrole reversal (resistance becomes support)).
From this example,a trading method focusing on past resistance lines (prominent highs), role reversals (resistance to support turns), and moving averagesand themBDSR signalshow strong compatibility.
※Please note that the charts introduced in this article may have added circles, lines, or boxes for explanatory convenience.
An indicator that shines when combined with RCI【BODSOR・mBDSR】
and methods & case studies (PDF) ★Winner of GogoJungle AWARD2020★
https://www.gogojungle.co.jp/tools/indicators/11836
The PDF file includes 358 files (over 1,400 pages, over 470,000 characters).
Many of them aresummaries of how to logically link the higher timeframe and lower timeframe using 3-line RCI, examining multiple lower-timeframe conditions step by step, and ultimately waiting for a dip-buy or rally-sell timing (i.e., mBDSR signal) on the lower timeframe.
In addition,many emphasize identifying points where multiple entry reasons coincideas well.
Also included is a method for exploring ascent and decline targets using 3-line RCI.
In the PDF explanations,over 1,350 chartsare used.

mBDSR (Product ID 11836) Purchase Bonus】 MT5 Version Indicator (Beta) “mBDSR (No Filter, RCI Filter, MA Filter)”
https://www.gogojungle.co.jp/tools/indicators/56765
【Master RCI!! Trend Reversal, Buy on Dips, Sell on Rallies】
An indicator that shines when combined with RCI【BODSOR・mBDSR】
and methods & case studies (PDF) ★Winner of GogoJungle AWARD2020★
https://www.gogojungle.co.jp/tools/indicators/11836
GBP/NZD, 1-hour chart
In the 1-hour chart above,Resistance lineis breached upward, and then around where1-hour EMA21converges with that linemBDSR (2-filter RCI) Buy-the-dip signallights up, and afterward, the price rises smoothly (a so-calledrole reversal (resistance becomes support)).
From this example,a trading method focusing on past resistance lines (prominent highs), role reversals (resistance to support turns), and moving averagesand themBDSR signalshow strong compatibility.
※Please note that the charts introduced in this article may have added circles, lines, or boxes for explanatory convenience.
An indicator that shines when combined with RCI【BODSOR・mBDSR】
and methods & case studies (PDF) ★Winner of GogoJungle AWARD2020★
https://www.gogojungle.co.jp/tools/indicators/11836
The PDF file includes 358 files (over 1,400 pages, over 470,000 characters).
Many of them aresummaries of how to logically link the higher timeframe and lower timeframe using 3-line RCI, examining multiple lower-timeframe conditions step by step, and ultimately waiting for a dip-buy or rally-sell timing (i.e., mBDSR signal) on the lower timeframe.
In addition,many emphasize identifying points where multiple entry reasons coincideas well.
Also included is a method for exploring ascent and decline targets using 3-line RCI.
In the PDF explanations,over 1,350 chartsare used.
× ![]()


