

Break of support (Dow Theory) and return-selling signal from mBDSR (RCI two-filter)
【MT5 Version Beta】 has been released!!
mBDSR (Product ID 11836) Purchase Bonus】 MT5 Version Indicator (Beta) “mBDSR (no filter, RCI filter, MA filter)”
https://www.gogojungle.co.jp/tools/indicators/56765
【Mastering RCI!! Trend Reversal, Buy on Dips, Sell on Rallies】
An indicator that shines when used in combination with RCI【BODSOR・mBDSR】
and the method & case studies (PDF) ★GogoJungle AWARD2020 Winner★
https://www.gogojungle.co.jp/tools/indicators/11836
GBP/JPY 5-minute chart
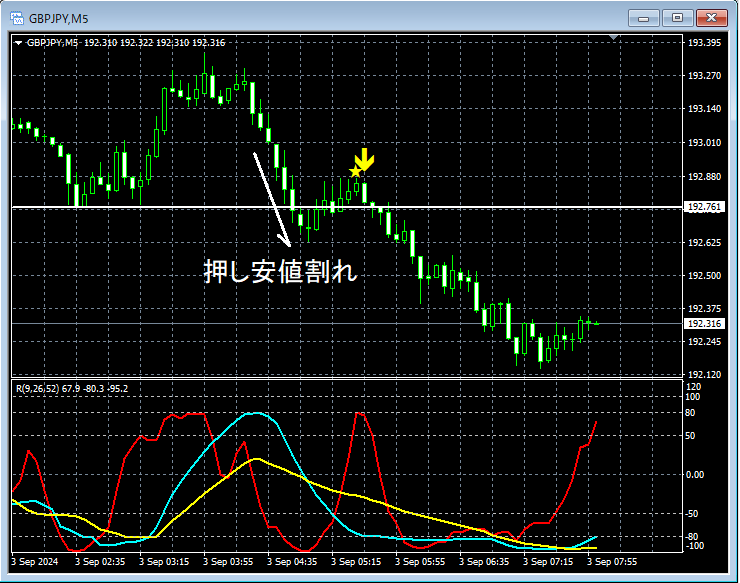
On the 5-minute chart above,a break below the swing lowtriggers an upward movementmBDSR (2 RCI filters)and the subsequent price declines smoothly.
From this example,the trading method focusing on Dow Theoryandthe signals of mBDSRshow a high degree of compatibility.
※Please note that in the charts introduced in this article, for convenience of explanation, circles, lines, and boxes may have been added.
An indicator that shines when used in combination with RCI【BODSOR・mBDSR】
and the method & case studies (PDF) ★GogoJungle AWARD2020 Winner★
https://www.gogojungle.co.jp/tools/indicators/11836
The PDF file includes 358 documents (over 1,400 pages, over 470,000 words).
Many of them articulate how to logically link higher and lower timeframes using the 3-line RCI, examine the conditions across multiple lower timeframes, and ultimately wait for a dip-buy or rally-sell signal on the lower timeframe (i.e., mBDSR signals).
Additionally,many focus on identifying points where multiple entry reasons overlap.There are many such cases.
Note also thatthere are methods that explore upside and downside targets using the 3-line RCIas well.
In the PDF explanations,over 1,350 chartsare used.

mBDSR (Product ID 11836) Purchase Bonus】 MT5 Version Indicator (Beta) “mBDSR (no filter, RCI filter, MA filter)”
https://www.gogojungle.co.jp/tools/indicators/56765
【Mastering RCI!! Trend Reversal, Buy on Dips, Sell on Rallies】
An indicator that shines when used in combination with RCI【BODSOR・mBDSR】
and the method & case studies (PDF) ★GogoJungle AWARD2020 Winner★
https://www.gogojungle.co.jp/tools/indicators/11836
GBP/JPY 5-minute chart
On the 5-minute chart above,a break below the swing lowtriggers an upward movementmBDSR (2 RCI filters)and the subsequent price declines smoothly.
From this example,the trading method focusing on Dow Theoryandthe signals of mBDSRshow a high degree of compatibility.
※Please note that in the charts introduced in this article, for convenience of explanation, circles, lines, and boxes may have been added.
An indicator that shines when used in combination with RCI【BODSOR・mBDSR】
and the method & case studies (PDF) ★GogoJungle AWARD2020 Winner★
https://www.gogojungle.co.jp/tools/indicators/11836
The PDF file includes 358 documents (over 1,400 pages, over 470,000 words).
Many of them articulate how to logically link higher and lower timeframes using the 3-line RCI, examine the conditions across multiple lower timeframes, and ultimately wait for a dip-buy or rally-sell signal on the lower timeframe (i.e., mBDSR signals).
Additionally,many focus on identifying points where multiple entry reasons overlap.There are many such cases.
Note also thatthere are methods that explore upside and downside targets using the 3-line RCIas well.
In the PDF explanations,over 1,350 chartsare used.
× ![]()


