

重要視している移動平均線とダブルボトムとカウンタートレンドラインとmBDSR(RCI2本フィルター)のサイン
0
【MT5 Version Beta】 has been released!!
mBDSR (Product ID 11836) Purchase Bonus】 MT5 Version Indicator (Beta) “mBDSR (No Filter, RCI Filter, MA Filter)”
https://www.gogojungle.co.jp/tools/indicators/56765
【Master RCI!! Trend Reversal, Buy on Dips, Sell on Rallies】
An indicator that excels when used together with RCI: 【BODSOR・mBDSR】
and method, case studies (PDF) ★GogoJungle AWARD2020 Winner★
https://www.gogojungle.co.jp/tools/indicators/11836
NZD/JPY, NZDJPY, 5-minute chart
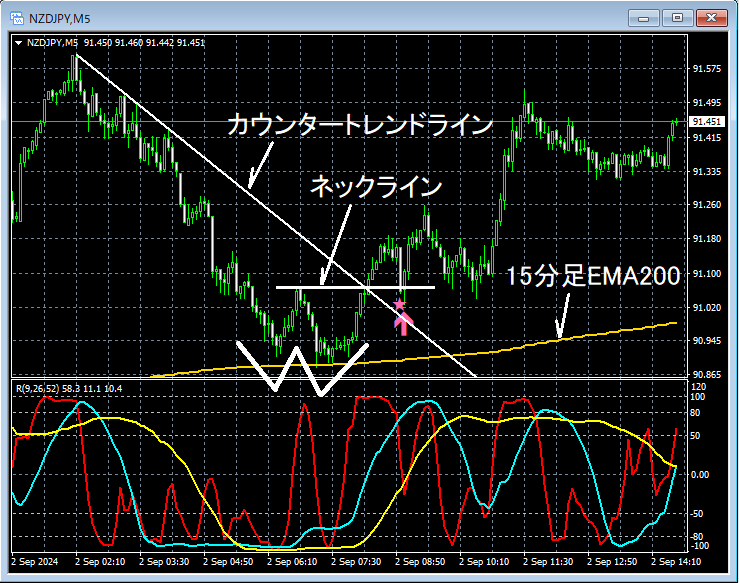
The higher timeframe is omitted. On the 5-minute chart above, what is considered importantis located near the 200-period EMA on the 15-minute chartaround whichDouble Bottomis formed and rebounds, breaking above the counter-trend line. After that, theDouble Bottomreaches near theNecklineand thenmBDSR (RCI with two filters) Buy-on-Dip signallights up and the price rises solidly.
From this example,the trading method that focuses on key moving averages, double bottoms, necklines, and counter-trend linesandthe signal from mBDSRshow strong harmony.
※Please note that in this article’s charts, for convenience of explanation,円 markings, straight lines, and squares may be added.
An indicator that shines in combination with RCI【BODSOR・mBDSR】
and method, case studies (PDF) ★GogoJungle AWARD2020 Winner★
https://www.gogojungle.co.jp/tools/indicators/11836
The PDF file comes with 358 files (over 1,400 pages, over 470,000 characters).
Many of them areexamples that systematically examine multiple lower-timeframe conditions by linking the higher and lower timeframes logically using the three-line RCI, finally waiting for the dip buy or pullback sell timing (i.e., the mBDSR signal) on the lower timeframe.
In addition,many entries focus on identifying overlapping reasons for entries.
Also,there is content exploring ascent and decline targets using three RCI lines.
In the PDF explanations,more than 1,350 chartsare used.

mBDSR (Product ID 11836) Purchase Bonus】 MT5 Version Indicator (Beta) “mBDSR (No Filter, RCI Filter, MA Filter)”
https://www.gogojungle.co.jp/tools/indicators/56765
【Master RCI!! Trend Reversal, Buy on Dips, Sell on Rallies】
An indicator that excels when used together with RCI: 【BODSOR・mBDSR】
and method, case studies (PDF) ★GogoJungle AWARD2020 Winner★
https://www.gogojungle.co.jp/tools/indicators/11836
NZD/JPY, NZDJPY, 5-minute chart
The higher timeframe is omitted. On the 5-minute chart above, what is considered importantis located near the 200-period EMA on the 15-minute chartaround whichDouble Bottomis formed and rebounds, breaking above the counter-trend line. After that, theDouble Bottomreaches near theNecklineand thenmBDSR (RCI with two filters) Buy-on-Dip signallights up and the price rises solidly.
From this example,the trading method that focuses on key moving averages, double bottoms, necklines, and counter-trend linesandthe signal from mBDSRshow strong harmony.
※Please note that in this article’s charts, for convenience of explanation,円 markings, straight lines, and squares may be added.
An indicator that shines in combination with RCI【BODSOR・mBDSR】
and method, case studies (PDF) ★GogoJungle AWARD2020 Winner★
https://www.gogojungle.co.jp/tools/indicators/11836
The PDF file comes with 358 files (over 1,400 pages, over 470,000 characters).
Many of them areexamples that systematically examine multiple lower-timeframe conditions by linking the higher and lower timeframes logically using the three-line RCI, finally waiting for the dip buy or pullback sell timing (i.e., the mBDSR signal) on the lower timeframe.
In addition,many entries focus on identifying overlapping reasons for entries.
Also,there is content exploring ascent and decline targets using three RCI lines.
In the PDF explanations,more than 1,350 chartsare used.
× ![]()


