

Utilize both the sign of mBDSR (RCI2本フィルター) and the sign of R1R2S2 (1)
0
Indicator to Capture Tops and Reversals in Combination with RCI【mBDSR】
Methods and Case Studies (PDF) ★GogoJungle AWARD2020 Recipient★
https://www.gogojungle.co.jp/tools/indicators/11836
The above product includes 301 PDFs (methods, case studies, etc.). For a list of the PDF titles, please refer to the article below.
About the 301 PDF files included with 【BODSOR・mBDSR】
https://www.gogojungle.co.jp/finance/navi/articles/34271
R1R2S2 is included in the above product. For details, please refer to the article below in Investment Navi+.
Release of the indicator "R1R2S2" that targets trend reversals, pullbacks, and pullbacks with two-stage judgments using RCI three-line
Below,mBDSR (RCI two-line filter)andR1R2S2signs are shown simultaneously as examples.
USD/JPY 5-minute chart
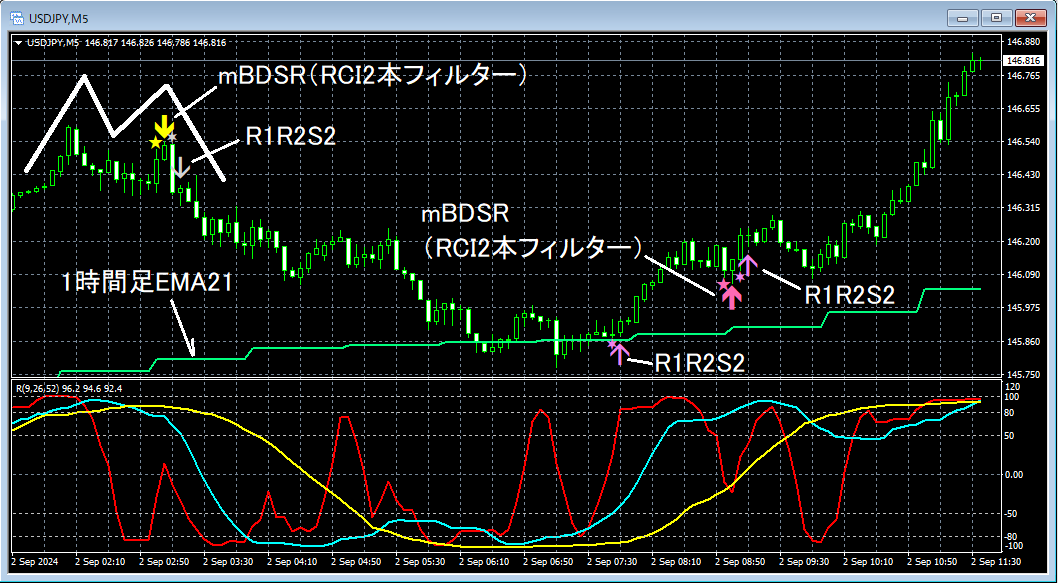
mBDSR (RCI two-line filter)andR1R2S2signs
First,the right-side valley of the double bottomhas thesell signal of the mBDSR (RCI two-line filter)illuminated. In this example, if this signal is overlooked, you can use the nearbysell signal of R1R2S2instead.
Next,the 1-hour EMA21 rebounddoes not illuminate apullback buy signal of mBDSR (RCI two-line filter)in this example,you can use the buy signal of R1R2S2.
Furthermore, during the rise,the pullback buy signal of mBDSR (RCI two-line filter)is illuminated. In this case, if you miss this signal, you can use the nearby.
An indicator that shines in combination with RCI: 【BODSOR・mBDSR】
Methods and Case Studies (PDF) ★GogoJungle AWARD2020 Recipient★
https://www.gogojungle.co.jp/tools/indicators/11836
The PDF files come with 301 PDFs (over 1,000 pages in total, over 350,000 characters in total).
Many of them are a compilation of examples that break down the process of using the RCI three-line setup to logically link higher and lower timeframes, sequentially examining multiple lower-timeframe conditions, and ultimately waiting for pullbacks or pullback buy/sell signals on the lower timeframes (the mBDSR signals).many focus on capturing points where multiple entry reasons align.In addition,
.
The explanations usemore than 1,000 charts..

Methods and Case Studies (PDF) ★GogoJungle AWARD2020 Recipient★
https://www.gogojungle.co.jp/tools/indicators/11836
The above product includes 301 PDFs (methods, case studies, etc.). For a list of the PDF titles, please refer to the article below.
About the 301 PDF files included with 【BODSOR・mBDSR】
https://www.gogojungle.co.jp/finance/navi/articles/34271
R1R2S2 is included in the above product. For details, please refer to the article below in Investment Navi+.
Release of the indicator "R1R2S2" that targets trend reversals, pullbacks, and pullbacks with two-stage judgments using RCI three-line
Below,mBDSR (RCI two-line filter)andR1R2S2signs are shown simultaneously as examples.
USD/JPY 5-minute chart
mBDSR (RCI two-line filter)andR1R2S2signs
First,the right-side valley of the double bottomhas thesell signal of the mBDSR (RCI two-line filter)illuminated. In this example, if this signal is overlooked, you can use the nearbysell signal of R1R2S2instead.
Next,the 1-hour EMA21 rebounddoes not illuminate apullback buy signal of mBDSR (RCI two-line filter)in this example,you can use the buy signal of R1R2S2.
Furthermore, during the rise,the pullback buy signal of mBDSR (RCI two-line filter)is illuminated. In this case, if you miss this signal, you can use the nearby.
An indicator that shines in combination with RCI: 【BODSOR・mBDSR】
Methods and Case Studies (PDF) ★GogoJungle AWARD2020 Recipient★
https://www.gogojungle.co.jp/tools/indicators/11836
The PDF files come with 301 PDFs (over 1,000 pages in total, over 350,000 characters in total).
Many of them are a compilation of examples that break down the process of using the RCI three-line setup to logically link higher and lower timeframes, sequentially examining multiple lower-timeframe conditions, and ultimately waiting for pullbacks or pullback buy/sell signals on the lower timeframes (the mBDSR signals).many focus on capturing points where multiple entry reasons align.In addition,
.
The explanations usemore than 1,000 charts..
× ![]()


