

Return sell signal on higher timeframe: previous high and pin bar, and on lower timeframe: mBDSR pullback selling signal
0
【Mastering RCI!! Trend Reversal, Buy-on-Dip, and Sell on Rallies】
Indicator that is powerful when used in combination with RCI【BODSOR・mBDSR】
and methods・case studies (PDF) ★GogoJungle AWARD2020 winner★
https://www.gogojungle.co.jp/tools/indicators/11836
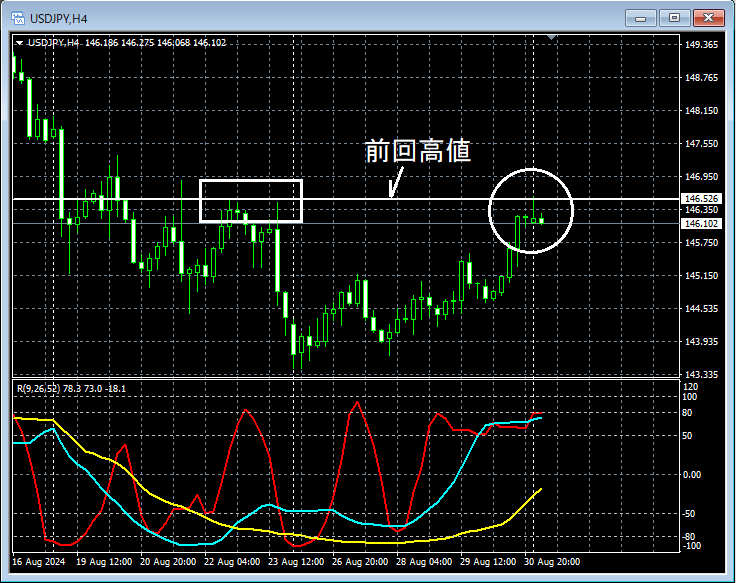
USD/JPY 4-hour chart
USD/JPY 1-hour chart
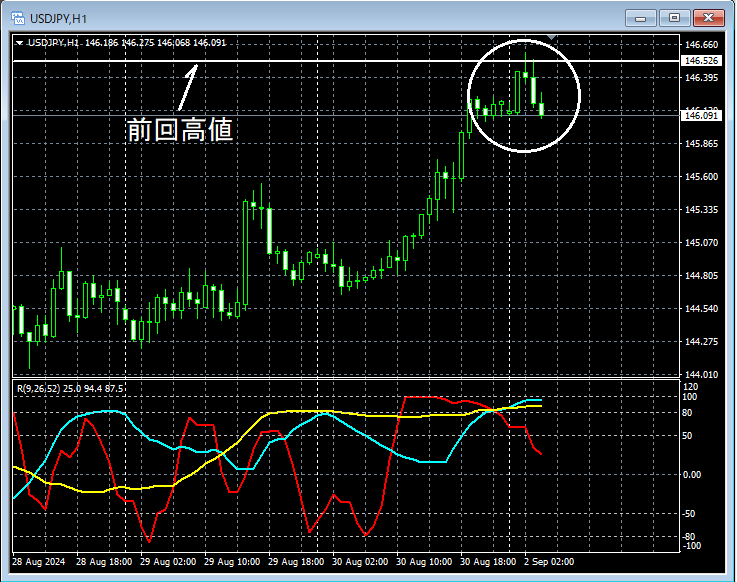
On the 1-hour chart above, in the area circled in white,it has risen toward near the previous high on the 4-hour chart,indicating a potential for a decline.Pin bar (candle with a long upper wick)appears, so it may not be unusual to consider selling on rallies on the lower time frame.
USD/JPY 5-minute chart
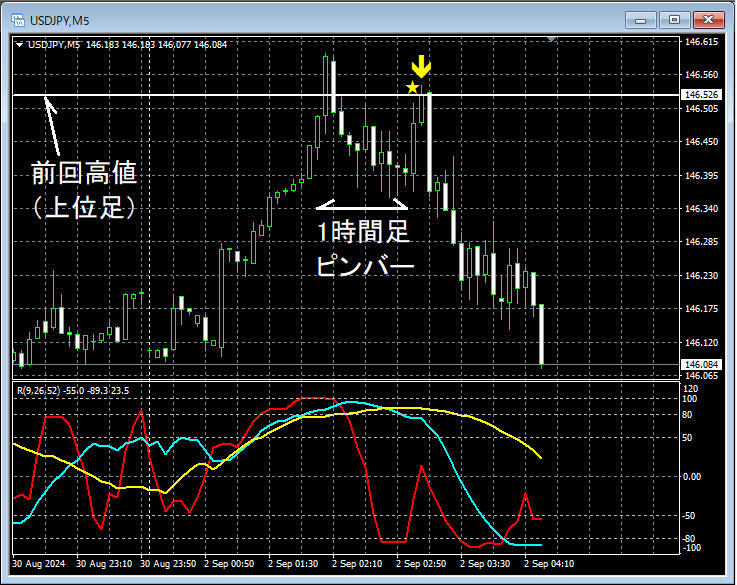
In the 5-minute chart above, as thePin bar (candle with a long upper wick)appeared on the 1-hour chart, the price declined and then rose again,the mBDSR (two RCI filters) buy-back signallit up and the price firmly moved lower.
From this example,the compatibility of a trading method that focuses on the previous high and Pin bar (long upper wick)withthe signals of the mBDSRis evident.
※Please note that for convenience in this article, charts may include added circles, lines, or rectangles.
Indicator that is powerful when used in combination with RCI【BODSOR・mBDSR】
and methods・case studies (PDF) ★GogoJungle AWARD2020 winner★
https://www.gogojungle.co.jp/tools/indicators/11836
The PDF file comes with 358 files (over 1,400 pages, over 470,000 characters).
Many of them aresummaries of how to logically link higher and lower time frames using the three RCI lines, iteratively examining multiple lower time frames, and ultimately waiting for buy-on-dip or sell-on-rally timing (i.e., mBDSR signals) on the lower time frameas examples.
Also,many emphasize identifying points where multiple entry rationale overlapas well.
Additionally,there are methods that explore ascent and decline targets using three RCI linesincluded.
In the PDF explanations,more than 1,350 chartsare used.

Indicator that is powerful when used in combination with RCI【BODSOR・mBDSR】
and methods・case studies (PDF) ★GogoJungle AWARD2020 winner★
https://www.gogojungle.co.jp/tools/indicators/11836
USD/JPY 4-hour chart
USD/JPY 1-hour chart
On the 1-hour chart above, in the area circled in white,it has risen toward near the previous high on the 4-hour chart,indicating a potential for a decline.Pin bar (candle with a long upper wick)appears, so it may not be unusual to consider selling on rallies on the lower time frame.
USD/JPY 5-minute chart
In the 5-minute chart above, as thePin bar (candle with a long upper wick)appeared on the 1-hour chart, the price declined and then rose again,the mBDSR (two RCI filters) buy-back signallit up and the price firmly moved lower.
From this example,the compatibility of a trading method that focuses on the previous high and Pin bar (long upper wick)withthe signals of the mBDSRis evident.
※Please note that for convenience in this article, charts may include added circles, lines, or rectangles.
Indicator that is powerful when used in combination with RCI【BODSOR・mBDSR】
and methods・case studies (PDF) ★GogoJungle AWARD2020 winner★
https://www.gogojungle.co.jp/tools/indicators/11836
The PDF file comes with 358 files (over 1,400 pages, over 470,000 characters).
Many of them aresummaries of how to logically link higher and lower time frames using the three RCI lines, iteratively examining multiple lower time frames, and ultimately waiting for buy-on-dip or sell-on-rally timing (i.e., mBDSR signals) on the lower time frameas examples.
Also,many emphasize identifying points where multiple entry rationale overlapas well.
Additionally,there are methods that explore ascent and decline targets using three RCI linesincluded.
In the PDF explanations,more than 1,350 chartsare used.
× ![]()


