

【mBDSR (Moving Average Filter) Sell Signal】Watch the neckline of the double top (Nikkei 225 JP225)
0
【Mastering RCI!! Trend Reversal, Buy-the-Dip, and Sell-the-Rally】
Indicator that shines in combination with RCI【BODSOR・mBDSR】
and methods & case studies (PDF) ★GogoJungle AWARD2020 winner★
https://www.gogojungle.co.jp/tools/indicators/11836
mBDSR (RCI Filter)andmBDSR (Moving Average Filter)have different roles. Their usage is also touched upon in the above PDF.
Below,mBDSR (Moving Average Filter)sign examples are introduced.
Nikkei Average / JP225 / 1-hour chart
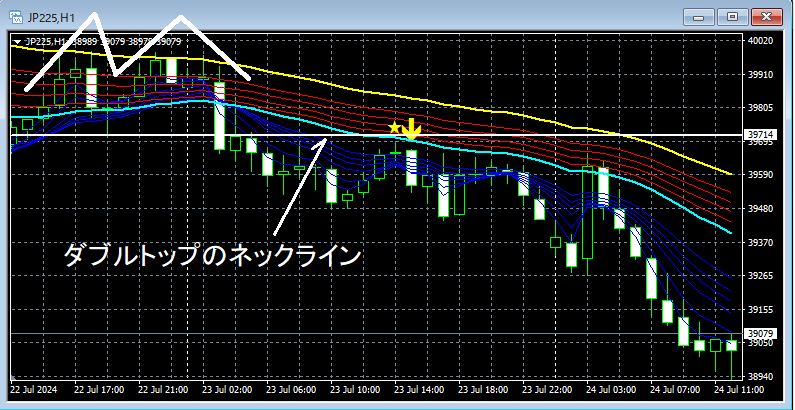
If you look around the area circled with a white circle on the 1-hour chart above,the neck line of the double tophas risen to near bythe return-sell signal of the moving average filter (mBDSR)lights up, and afterwards, the price steadily declines.
From this example,a trading method that focuses on the double top and its neck lineandthe signals of mBDSRshowing strong compatibility.
※Please note that in the charts introduced in this article, for ease of explanation, circles, straight lines, and squares may have been added.
Indicator that shines in combination with RCI【BODSOR・mBDSR】
and methods & case studies (PDF) ★GogoJungle AWARD2020 winner★
https://www.gogojungle.co.jp/tools/indicators/11836
The PDF file includes 358 items (over 1,400 pages, over 470,000 characters in total).
Most of them are collections of examples that detail how, using three RCI lines to logically link higher and lower timeframes, they examine the situations on multiple lower timeframes step by step, ultimately waiting for a dip-buy or rally-sell timing (i.e., mBDSR signals) on the lower timeframes.
Additionally,many focus on identifying points where multiple entry reasons overlap.There are also many that emphasize this.
Moreover,there are methods that explore upside and downside targets using three RCI lines.Also included.
In the PDF explanations,over 1,350 chartsare used.

Indicator that shines in combination with RCI【BODSOR・mBDSR】
and methods & case studies (PDF) ★GogoJungle AWARD2020 winner★
https://www.gogojungle.co.jp/tools/indicators/11836
mBDSR (RCI Filter)andmBDSR (Moving Average Filter)have different roles. Their usage is also touched upon in the above PDF.
Below,mBDSR (Moving Average Filter)sign examples are introduced.
Nikkei Average / JP225 / 1-hour chart
If you look around the area circled with a white circle on the 1-hour chart above,the neck line of the double tophas risen to near bythe return-sell signal of the moving average filter (mBDSR)lights up, and afterwards, the price steadily declines.
From this example,a trading method that focuses on the double top and its neck lineandthe signals of mBDSRshowing strong compatibility.
※Please note that in the charts introduced in this article, for ease of explanation, circles, straight lines, and squares may have been added.
Indicator that shines in combination with RCI【BODSOR・mBDSR】
and methods & case studies (PDF) ★GogoJungle AWARD2020 winner★
https://www.gogojungle.co.jp/tools/indicators/11836
The PDF file includes 358 items (over 1,400 pages, over 470,000 characters in total).
Most of them are collections of examples that detail how, using three RCI lines to logically link higher and lower timeframes, they examine the situations on multiple lower timeframes step by step, ultimately waiting for a dip-buy or rally-sell timing (i.e., mBDSR signals) on the lower timeframes.
Additionally,many focus on identifying points where multiple entry reasons overlap.There are also many that emphasize this.
Moreover,there are methods that explore upside and downside targets using three RCI lines.Also included.
In the PDF explanations,over 1,350 chartsare used.
× ![]()


