

[mBDSR (RCI2 Full Filter) Buy Signal] Focus on the noticeable high price (Nikkei Average JP225)
0
【Mastering RCI!! Trend Reversal, Buy the Dip, Sell on Rallies】
Indicator【BODSOR・mBDSR】that shines in combination with RCI
Methods and Case Studies (PDF) ★GogoJungle AWARD2020 Winner★
https://www.gogojungle.co.jp/tools/indicators/11836
Nikkei Average JP225 5-minute chart
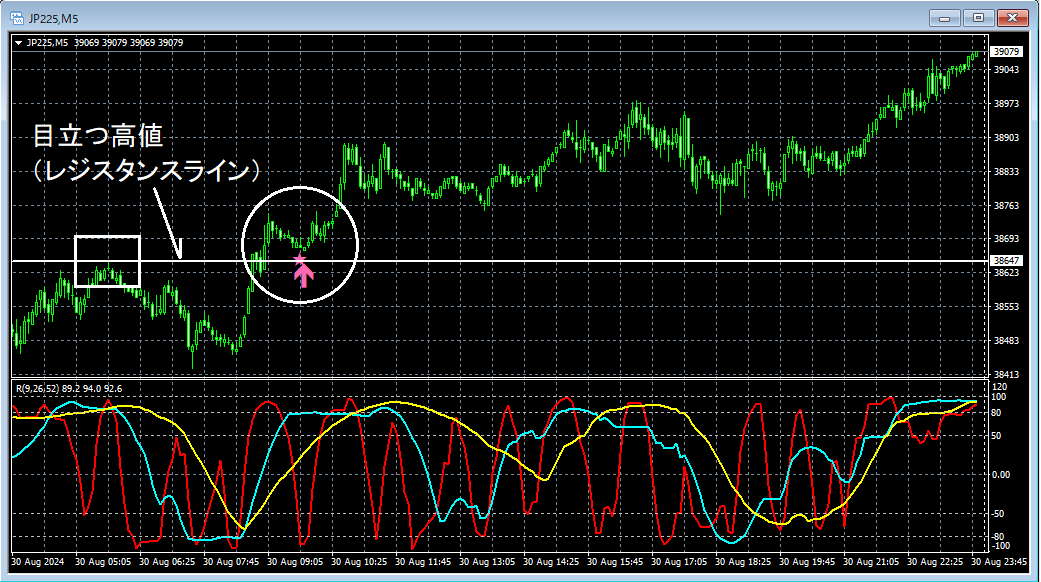
If you look at the area circled in white on the upper 5-minute chart,near a notable highas it has dropped to the vicinity ofthe mBDSR (two RCI lines) buy-the-dip signallights up, and subsequently, price clearly rises.
From this example,a trading method that focuses on notable highsandthe signal of mBDSRshow a high level of compatibility.
※Please note that charts introduced in this article may have added circles, lines, rectangles, etc. for explanatory convenience.
Indicator【BODSOR・mBDSR】that shines in combination with RCI
Methods and Case Studies (PDF) ★GogoJungle AWARD2020 Winner★
https://www.gogojungle.co.jp/tools/indicators/11836
The PDF file includes 358 items (over 1,400 pages, over 470,000 characters in total).
Most of them aresummaries that use the three-RCI-line to logically link higher and lower timeframes, progressively examining the conditions of multiple lower-timeframe charts and ultimately waiting for a buy-the-dip timing or a sell-on-rallies timing (i.e., the signal of mBDSR) on the lower timeframe..
Additionally,many focus on identifying points where multiple entry bases coincide..
Also included is a method for exploring upside and downside prospects using the three-RCI-line.
In the PDF explanations,more than 1,350 chartsare used.

Indicator【BODSOR・mBDSR】that shines in combination with RCI
Methods and Case Studies (PDF) ★GogoJungle AWARD2020 Winner★
https://www.gogojungle.co.jp/tools/indicators/11836
Nikkei Average JP225 5-minute chart
If you look at the area circled in white on the upper 5-minute chart,near a notable highas it has dropped to the vicinity ofthe mBDSR (two RCI lines) buy-the-dip signallights up, and subsequently, price clearly rises.
From this example,a trading method that focuses on notable highsandthe signal of mBDSRshow a high level of compatibility.
※Please note that charts introduced in this article may have added circles, lines, rectangles, etc. for explanatory convenience.
Indicator【BODSOR・mBDSR】that shines in combination with RCI
Methods and Case Studies (PDF) ★GogoJungle AWARD2020 Winner★
https://www.gogojungle.co.jp/tools/indicators/11836
The PDF file includes 358 items (over 1,400 pages, over 470,000 characters in total).
Most of them aresummaries that use the three-RCI-line to logically link higher and lower timeframes, progressively examining the conditions of multiple lower-timeframe charts and ultimately waiting for a buy-the-dip timing or a sell-on-rallies timing (i.e., the signal of mBDSR) on the lower timeframe..
Additionally,many focus on identifying points where multiple entry bases coincide..
Also included is a method for exploring upside and downside prospects using the three-RCI-line.
In the PDF explanations,more than 1,350 chartsare used.
× ![]()


