

The Importance of Filtering from Higher-Order Bars to Lower-Order Bars and the Sign of mBDSR (RCI 2-Filter) (10)
0
【Mastering RCI!! Trend Reversals, Buy on Dips, Sell on Rallies】
Indicator that shines in combination with RCI: 【BODSOR・mBDSR】
and method・case studies (PDF) ★GogoJungle AWARD2020 winner★
https://www.gogojungle.co.jp/tools/indicators/11836
Pound/Japanese Yen GBPCHF 1-minute chart
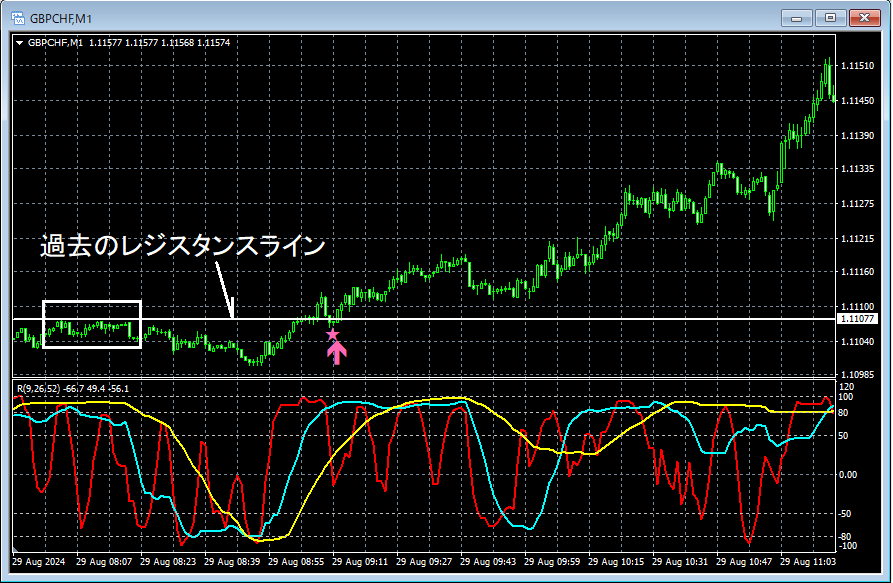
The status of the higher timeframes is omitted. Also,the consolidation from higher timeframes to lower timeframes using RCIis described in detail in the included PDF, so it is omitted here as well.
In actual trading, when planning a strategy,understanding the higher timeframe contextandconsolidation from higher to lower timeframes using RCIare extremely important.
In the 1-minute chart above,the previous resistance line near the lower pricehas been reached,the mBDSR (two RCI filters) buy-on-dip signallights up and the price rises significantly.
In this example, by placing the stop-loss slightly below the recent low,a trade with a favorable risk-reward ratiois possible. (By understanding the higher timeframe context and performing consolidation from higher to lower timeframes using RCI,a favorable risk-reward tradeis attainable.)
*Please note that in the charts shown in this article, for convenience of explanation, circles, lines, and rectangles may be drawn.
Indicator that shines in combination with RCI: 【BODSOR・mBDSR】
and method・case studies (PDF) ★GogoJungle AWARD2020 winner★
https://www.gogojungle.co.jp/tools/indicators/11836
The PDF file includes 358 files (over 1,400 pages, over 470,000 characters in total).
Most of them aresummaries of cases where multiple higher-timeframe to lower-timeframe links are made logically using three RCI lines, examining the conditions of multiple lower timeframes successively, and ultimately waiting for dips or pullbacks signals on the lower timeframes (i.e., mBDSR signals)..
Additionally,many focus on pinpointing points where multiple entry grounds overlap..
Furthermore,there are methods for exploring upside targets and downside targets using three RCI lines..
In the PDF explanations,over 1,350 chartsare used.

Indicator that shines in combination with RCI: 【BODSOR・mBDSR】
and method・case studies (PDF) ★GogoJungle AWARD2020 winner★
https://www.gogojungle.co.jp/tools/indicators/11836
Pound/Japanese Yen GBPCHF 1-minute chart
The status of the higher timeframes is omitted. Also,the consolidation from higher timeframes to lower timeframes using RCIis described in detail in the included PDF, so it is omitted here as well.
In actual trading, when planning a strategy,understanding the higher timeframe contextandconsolidation from higher to lower timeframes using RCIare extremely important.
In the 1-minute chart above,the previous resistance line near the lower pricehas been reached,the mBDSR (two RCI filters) buy-on-dip signallights up and the price rises significantly.
In this example, by placing the stop-loss slightly below the recent low,a trade with a favorable risk-reward ratiois possible. (By understanding the higher timeframe context and performing consolidation from higher to lower timeframes using RCI,a favorable risk-reward tradeis attainable.)
*Please note that in the charts shown in this article, for convenience of explanation, circles, lines, and rectangles may be drawn.
Indicator that shines in combination with RCI: 【BODSOR・mBDSR】
and method・case studies (PDF) ★GogoJungle AWARD2020 winner★
https://www.gogojungle.co.jp/tools/indicators/11836
The PDF file includes 358 files (over 1,400 pages, over 470,000 characters in total).
Most of them aresummaries of cases where multiple higher-timeframe to lower-timeframe links are made logically using three RCI lines, examining the conditions of multiple lower timeframes successively, and ultimately waiting for dips or pullbacks signals on the lower timeframes (i.e., mBDSR signals)..
Additionally,many focus on pinpointing points where multiple entry grounds overlap..
Furthermore,there are methods for exploring upside targets and downside targets using three RCI lines..
In the PDF explanations,over 1,350 chartsare used.
× ![]()


