

Importance of drilling down from higher timeframes to lower timeframes and the sign (9) of mBDSR (RCI2-filter)
【Mastering RCI!! Trend Reversals, Buy Dips, Sell Returns】
An indicator that shines when combined with RCI【BODSOR・mBDSR】
and its method and case studies (PDF) ★GogoJungle AWARD2020 winner★
https://www.gogojungle.co.jp/tools/indicators/11836
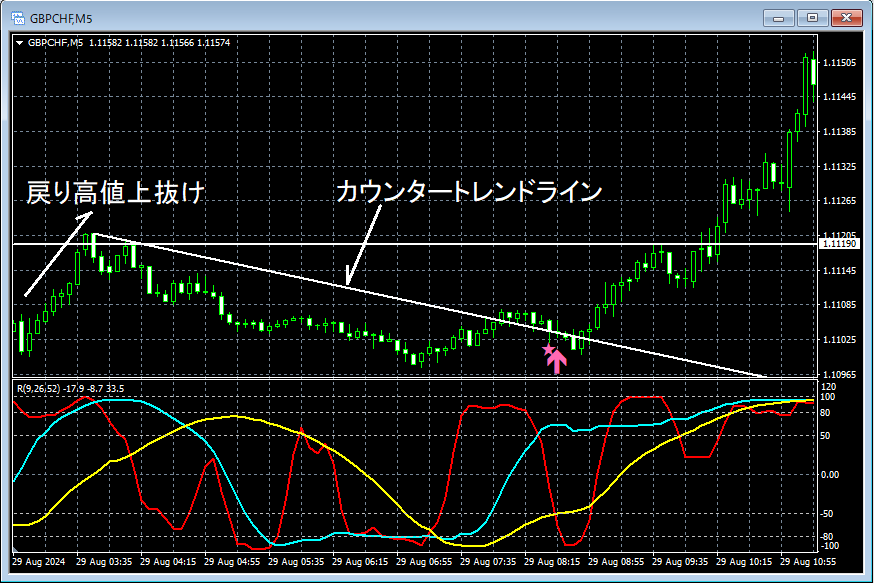
Pound Swiss GBPCHF 5-minute chart
Details about the higher timeframe are omitted. Also,the breakdown from higher timeframes to lower timeframes using RCIis explained in detail in the accompanying PDF, so that is omitted here as well.
In actual trading, when formulating a plan, it is crucial tounderstand the higher timeframe situationanduse RCI to map from higher to lower timeframesto the lower timeframes.
In the five-minute chart above,the pullback highis surpassed after a rally from a pullback,breaking the counter-trend line. Then on the subsequent declinethe mBDSR (RCI two-filter) buy-the-dip signallights up and the price rises sharply.
In this example, placing the stop-loss slightly below the most recent lowallows a favorable risk-reward trade. (By understanding the higher timeframe and mapping from higher to lower timeframes using RCI,a favorable risk-reward tradebecomes possible.)
※Please note that the charts shown in this article may include additions such as circles, lines, and rectangles for ease of explanation.
An indicator that shines when combined with RCI【BODSOR・mBDSR】
and its method and case studies (PDF) ★GogoJungle AWARD2020 winner★
https://www.gogojungle.co.jp/tools/indicators/11836
The PDF file has 358 items (over 1,400 pages, over 470,000 characters in total).
Many of themdetail how to logically link higher and lower timeframes using three RCI lines to examine multiple lower timeframes sequentially, ultimately waiting for pullback buys or pullback sells on the lower timeframes (signals from mBDSR)..
Also,many focus on identifying points where multiple entry reasons coincide..
In addition,there are methods that explore upside and downside targets using three RCI lines..
In the PDF explanations,more than 1,350 chartsare used.

An indicator that shines when combined with RCI【BODSOR・mBDSR】
and its method and case studies (PDF) ★GogoJungle AWARD2020 winner★
https://www.gogojungle.co.jp/tools/indicators/11836
Pound Swiss GBPCHF 5-minute chart
Details about the higher timeframe are omitted. Also,the breakdown from higher timeframes to lower timeframes using RCIis explained in detail in the accompanying PDF, so that is omitted here as well.
In actual trading, when formulating a plan, it is crucial tounderstand the higher timeframe situationanduse RCI to map from higher to lower timeframesto the lower timeframes.
In the five-minute chart above,the pullback highis surpassed after a rally from a pullback,breaking the counter-trend line. Then on the subsequent declinethe mBDSR (RCI two-filter) buy-the-dip signallights up and the price rises sharply.
In this example, placing the stop-loss slightly below the most recent lowallows a favorable risk-reward trade. (By understanding the higher timeframe and mapping from higher to lower timeframes using RCI,a favorable risk-reward tradebecomes possible.)
※Please note that the charts shown in this article may include additions such as circles, lines, and rectangles for ease of explanation.
An indicator that shines when combined with RCI【BODSOR・mBDSR】
and its method and case studies (PDF) ★GogoJungle AWARD2020 winner★
https://www.gogojungle.co.jp/tools/indicators/11836
The PDF file has 358 items (over 1,400 pages, over 470,000 characters in total).
Many of themdetail how to logically link higher and lower timeframes using three RCI lines to examine multiple lower timeframes sequentially, ultimately waiting for pullback buys or pullback sells on the lower timeframes (signals from mBDSR)..
Also,many focus on identifying points where multiple entry reasons coincide..
In addition,there are methods that explore upside and downside targets using three RCI lines..
In the PDF explanations,more than 1,350 chartsare used.
× ![]()


