

Translate the following HTML to English, keeping the HTML format, do not use code blocks or insert line breaks, and first decode any standard entities before translating: 上位足のダブルトップの右側の山で形成された下位足のダブルトップとmBDSR(RCI2本フィルター)の戻り売りサイン Translation: A reversal
【Mastering RCI!! Trend Reversal, Buy on Dips, Sell on Pullbacks】
Indicator that shines when combined with RCI: 【BODSOR・mBDSR】
Methodology and Case Study (PDF) ★GogoJungle AWARD 2020 Recipient★
https://www.gogojungle.co.jp/tools/indicators/11836
GBPCAD Pound Canadian Dollar Daily
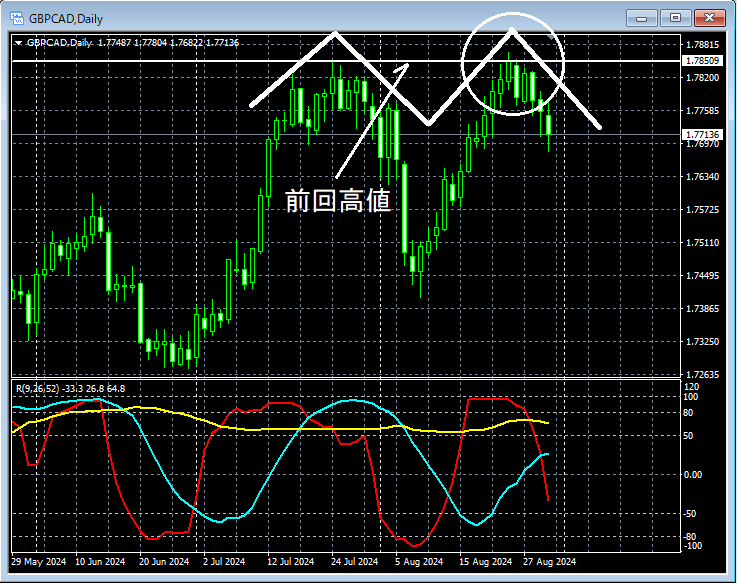
On the daily chart above,the previous highhas been reached by rising.The previous highmight not be clearly broken above yet, so a pullback selling setup may not be inappropriate to look for.
Here, on the daily chart,a double topcould form, so we’ll also inspect the area circled in white on a lower time frame in more detail.
GBPCAD Pound Canadian Dollar 4-hour
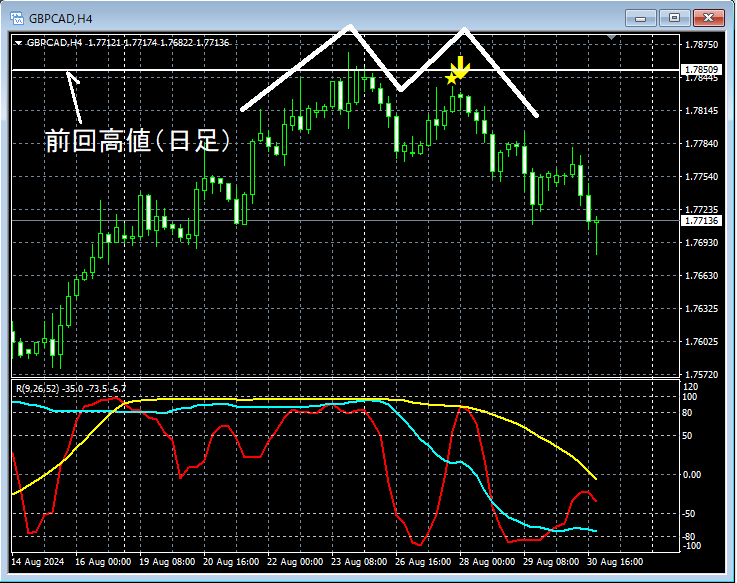
Watching the 4-hour chart above, around the area that could becomethe right-hand peak of the double top on the dailyandthe pullback sell signal of mBDSR (two RCI filters)lights up and declines. As a result, on the 4-hour chart,the right peak of the double topandthe pullback sell signal of mBDSR (two RCI filters)are shown to have lit up.
From this example,the trading approach focused on the double topandthe signals from mBDSRshow a high degree of compatibility.
Also in this example, by placing the stop loss slightly above the left peak of the daily double top (recent high)and the right above itit is possible to achieve a favorable risk-reward trade.
※Please note that in the charts presented in this article, circles, straight lines, and squares may be added for explanatory convenience.
Indicator that shines when combined with RCI: 【BODSOR・mBDSR】
Methodology and Case Study (PDF) ★GogoJungle AWARD 2020 Recipient★
https://www.gogojungle.co.jp/tools/indicators/11836
The PDF file includes 358 items (over 1,400 pages, over 470,000 characters in total).
Many of these are compiled as examples that link higher timeframe and lower timeframe logically using the RCI three-line setup, eventually narrowing down to waiting for pullbacks or entries on the lower timeframe (i.e., signals from mBDSR).
Additionally,There are also many examples that explore scenarios where multiple entry reasons align.
Furthermore,there are methods that explore upside and downside targets using the RCI three-line setup.These are included as well.
In the descriptions within the PDF files,over 1,350 chartsare used.

Indicator that shines when combined with RCI: 【BODSOR・mBDSR】
Methodology and Case Study (PDF) ★GogoJungle AWARD 2020 Recipient★
https://www.gogojungle.co.jp/tools/indicators/11836
GBPCAD Pound Canadian Dollar Daily
On the daily chart above,the previous highhas been reached by rising.The previous highmight not be clearly broken above yet, so a pullback selling setup may not be inappropriate to look for.
Here, on the daily chart,a double topcould form, so we’ll also inspect the area circled in white on a lower time frame in more detail.
GBPCAD Pound Canadian Dollar 4-hour
Watching the 4-hour chart above, around the area that could becomethe right-hand peak of the double top on the dailyandthe pullback sell signal of mBDSR (two RCI filters)lights up and declines. As a result, on the 4-hour chart,the right peak of the double topandthe pullback sell signal of mBDSR (two RCI filters)are shown to have lit up.
From this example,the trading approach focused on the double topandthe signals from mBDSRshow a high degree of compatibility.
Also in this example, by placing the stop loss slightly above the left peak of the daily double top (recent high)and the right above itit is possible to achieve a favorable risk-reward trade.
※Please note that in the charts presented in this article, circles, straight lines, and squares may be added for explanatory convenience.
Indicator that shines when combined with RCI: 【BODSOR・mBDSR】
Methodology and Case Study (PDF) ★GogoJungle AWARD 2020 Recipient★
https://www.gogojungle.co.jp/tools/indicators/11836
The PDF file includes 358 items (over 1,400 pages, over 470,000 characters in total).
Many of these are compiled as examples that link higher timeframe and lower timeframe logically using the RCI three-line setup, eventually narrowing down to waiting for pullbacks or entries on the lower timeframe (i.e., signals from mBDSR).
Additionally,There are also many examples that explore scenarios where multiple entry reasons align.
Furthermore,there are methods that explore upside and downside targets using the RCI three-line setup.These are included as well.
In the descriptions within the PDF files,over 1,350 chartsare used.
× ![]()


