

【mBDSR (Moving Average Filter) Sell Signal】Focus on noticeable lows (Bitcoin) (2)
【Mastering RCI!! Trend Reversals, Buy Dips, Sell on Rallies】
Indicator 【BODSOR・mBDSR】 that shines in combination with RCI
and methods・case studies (PDF) ★GogoJungle AWARD2020 Winner★
https://www.gogojungle.co.jp/tools/indicators/11836
mBDSR (RCI Filter)andmBDSR (Moving Average Filter)have different roles. The above PDF also touches on how to use them correctly.
Below,mBDSR (Moving Average Filter)sign alerts are introduced.
Bitcoin / USD BTCUSD 30-minute chart
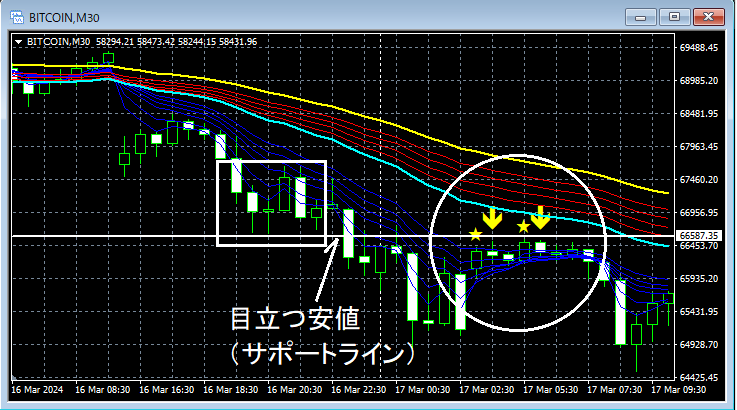
Looking at the area circled in white on the above 30-minute chart,prominent low (support line)where price has risen close to,mBDSR (Moving Average Filter) Sell-on-Rebound signallights up, and subsequently the price drops firmly.
From this example,a trading approach focused on prominent lows (support lines) and support/resistance turns (role reversals)andthe harmony with mBDSR signalscan be seen.
※Please note that in the charts introduced in this article, for convenience of explanation, circles, lines, and rectangles may have been added.
Indicator 【BODSOR・mBDSR】 that shines in combination with RCI
and methods・case studies (PDF) ★GogoJungle AWARD2020 Winner★
https://www.gogojungle.co.jp/tools/indicators/11836
The PDF file comprises 358 items (over 1,400 pages, over 470,000 characters in total).
Most of them are compiled in a way that uses three RCI lines to logically link higher and lower timeframes, sequentially considering the state of multiple lower timeframes, and finally waiting for dip-buy or pullback sell timing (i.e., mBDSR signals) on the lower timeframes.
In addition,many focus on identifying points where multiple entry grounds coincide.There are many such cases.
Additionally,there are methods using three RCI lines to explore upside targets and downside targets.Also included.
In the explanation within the PDF files,over 1,350 chartsare used.

Indicator 【BODSOR・mBDSR】 that shines in combination with RCI
and methods・case studies (PDF) ★GogoJungle AWARD2020 Winner★
https://www.gogojungle.co.jp/tools/indicators/11836
mBDSR (RCI Filter)andmBDSR (Moving Average Filter)have different roles. The above PDF also touches on how to use them correctly.
Below,mBDSR (Moving Average Filter)sign alerts are introduced.
Bitcoin / USD BTCUSD 30-minute chart
Looking at the area circled in white on the above 30-minute chart,prominent low (support line)where price has risen close to,mBDSR (Moving Average Filter) Sell-on-Rebound signallights up, and subsequently the price drops firmly.
From this example,a trading approach focused on prominent lows (support lines) and support/resistance turns (role reversals)andthe harmony with mBDSR signalscan be seen.
※Please note that in the charts introduced in this article, for convenience of explanation, circles, lines, and rectangles may have been added.
Indicator 【BODSOR・mBDSR】 that shines in combination with RCI
and methods・case studies (PDF) ★GogoJungle AWARD2020 Winner★
https://www.gogojungle.co.jp/tools/indicators/11836
The PDF file comprises 358 items (over 1,400 pages, over 470,000 characters in total).
Most of them are compiled in a way that uses three RCI lines to logically link higher and lower timeframes, sequentially considering the state of multiple lower timeframes, and finally waiting for dip-buy or pullback sell timing (i.e., mBDSR signals) on the lower timeframes.
In addition,many focus on identifying points where multiple entry grounds coincide.There are many such cases.
Additionally,there are methods using three RCI lines to explore upside targets and downside targets.Also included.
In the explanation within the PDF files,over 1,350 chartsare used.
× ![]()


