

[mBDSR (Moving Average Filter Return-Sell Signal) ] Focus on prominent lows (Bitcoin) (1)
【Mastering RCI!! Trend Reversal, Buy on Dips, Sell on Rallies】
Indicator that shines in combination with RCI: 【BODSOR・mBDSR】
and methods and case studies (PDF) ★GogoJungle AWARD2020 winner★
https://www.gogojungle.co.jp/tools/indicators/11836
mBDSR (RCI filter)andmBDSR (Moving Average filter)have different roles. The PDF above also touches on how to use them.
Below, we introduceexamples of signals for the moving average filter (mBDSR)
Bitcoin/US Dollar BTCUSD 30-minute chart
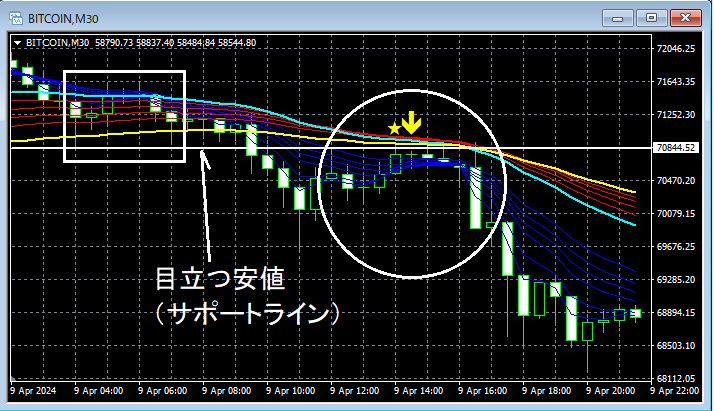
Looking at around the area circled in white on the 30-minute chart above,noticeable low (support line)rises to near that level,the mBDSR (Moving Average Filter) buyback/sell signallights up, and subsequently the price declines steadily.
From this example,a trading approach focusing on obvious lows (support lines) and support-turned-resistance (role reversal)andthe signal of mBDSRshow a high degree of compatibility.
*Please note that in the charts introduced in this article, for ease of explanation, circles, lines, and rectangles may have been added.
Indicator that shines in combination with RCI【BODSOR・mBDSR】
and methods and case studies (PDF) ★GogoJungle AWARD2020 winner★
https://www.gogojungle.co.jp/tools/indicators/11836
The PDF file includes 358 items (over 1,400 pages, over 470,000 characters in total).
Most of them are a collection of examples that break down how to logically link higher-timeframe and lower-timeframe using three RCI lines to assess multiple lower-timeframe conditions sequentially, ultimately waiting for dip-buying or pullback selling signals (i.e., mBDSR signals) on the lower timeframes.
Additionally,there are many that emphasize catching points where multiple entry reasons align..
Also included is a method for exploring upside and downside targets using three RCI lines.
In the explanations within the PDF filemore than 1,350 chartsare used.

Indicator that shines in combination with RCI: 【BODSOR・mBDSR】
and methods and case studies (PDF) ★GogoJungle AWARD2020 winner★
https://www.gogojungle.co.jp/tools/indicators/11836
mBDSR (RCI filter)andmBDSR (Moving Average filter)have different roles. The PDF above also touches on how to use them.
Below, we introduceexamples of signals for the moving average filter (mBDSR)
Bitcoin/US Dollar BTCUSD 30-minute chart
Looking at around the area circled in white on the 30-minute chart above,noticeable low (support line)rises to near that level,the mBDSR (Moving Average Filter) buyback/sell signallights up, and subsequently the price declines steadily.
From this example,a trading approach focusing on obvious lows (support lines) and support-turned-resistance (role reversal)andthe signal of mBDSRshow a high degree of compatibility.
*Please note that in the charts introduced in this article, for ease of explanation, circles, lines, and rectangles may have been added.
Indicator that shines in combination with RCI【BODSOR・mBDSR】
and methods and case studies (PDF) ★GogoJungle AWARD2020 winner★
https://www.gogojungle.co.jp/tools/indicators/11836
The PDF file includes 358 items (over 1,400 pages, over 470,000 characters in total).
Most of them are a collection of examples that break down how to logically link higher-timeframe and lower-timeframe using three RCI lines to assess multiple lower-timeframe conditions sequentially, ultimately waiting for dip-buying or pullback selling signals (i.e., mBDSR signals) on the lower timeframes.
Additionally,there are many that emphasize catching points where multiple entry reasons align..
Also included is a method for exploring upside and downside targets using three RCI lines.
In the explanations within the PDF filemore than 1,350 chartsare used.
× ![]()


